Sx1–Sx3 - Sample size and random samples
Good sampling starts with the question you want to answer, rather than the number of replies you can collect. You will explain why a sample may be needed, how its size affects the evidence, and why random selection provides a basis for drawing conclusions about a population.
Choose observations that answer the question
Would volunteers from a cycling forum tell you more about a city's commuting habits than residents selected randomly from a complete resident list? More replies sound persuasive, but first ask who those replies represent.
You already know
A statistic, such as a sample mean or proportion, summarises observed data. Different observations can give different summaries, even when they come from the same underlying population.
For a commuting study, specify the target before collecting anything: for example, the proportion of adult residents who cycle to work during a stated week. Forum users are not the same population as all adult residents, and people who volunteer may have particularly strong interests or opinions.
Population, sample and census
The population is the complete collection of individuals or observations about which information is wanted. A sample is a selection of observations used to investigate it; a census attempts to collect information from every member.
A sample may also be observations of a random variable, such as the lifetimes of batteries made by a production process, rather than a list of people.
A census can be impractical because the population is too large, because measurement takes too much time or money, or because testing destroys the items. Testing every bicycle helmet until it fails would leave no tested helmets available for use. A sample sacrifices complete information in exchange for a feasible investigation.
Desirable data must still address the target. The following are design questions, rather than promises that a particular sample will be perfect.
| Desirable feature | What it means in practice |
|---|---|
| Unbiased selection | Avoid a selection process that systematically favours particular outcomes or groups |
| Representative coverage | Give the relevant parts of the target population an appropriate opportunity to appear |
| Relevant observations | Measure the variable and time period that the question actually concerns |
| Adequate size | Collect enough information for the intended comparison, within time and cost limits |
| Observations not changed by collection | Avoid measuring behaviour that has been altered by the act of observing it |
For example, recording commuting speed while visibly following a cyclist might change how that cyclist rides. A large set of carefully recorded speeds would then describe the observed situation, which may differ from ordinary journeys. Likewise, asking only online respondents cannot cover residents who never use that service.
Key idea
A useful sample needs a sound selection process and suitable observations as well as a suitable size. “Representative” is a design aim; it is not guaranteed merely by collecting many replies.
These sampling principles are not in the formula booklet. In an explanation, connect the reason to the actual investigation: “testing destroys the helmets” says more than “sampling is better”.
Separate sample size, chance variation and bias
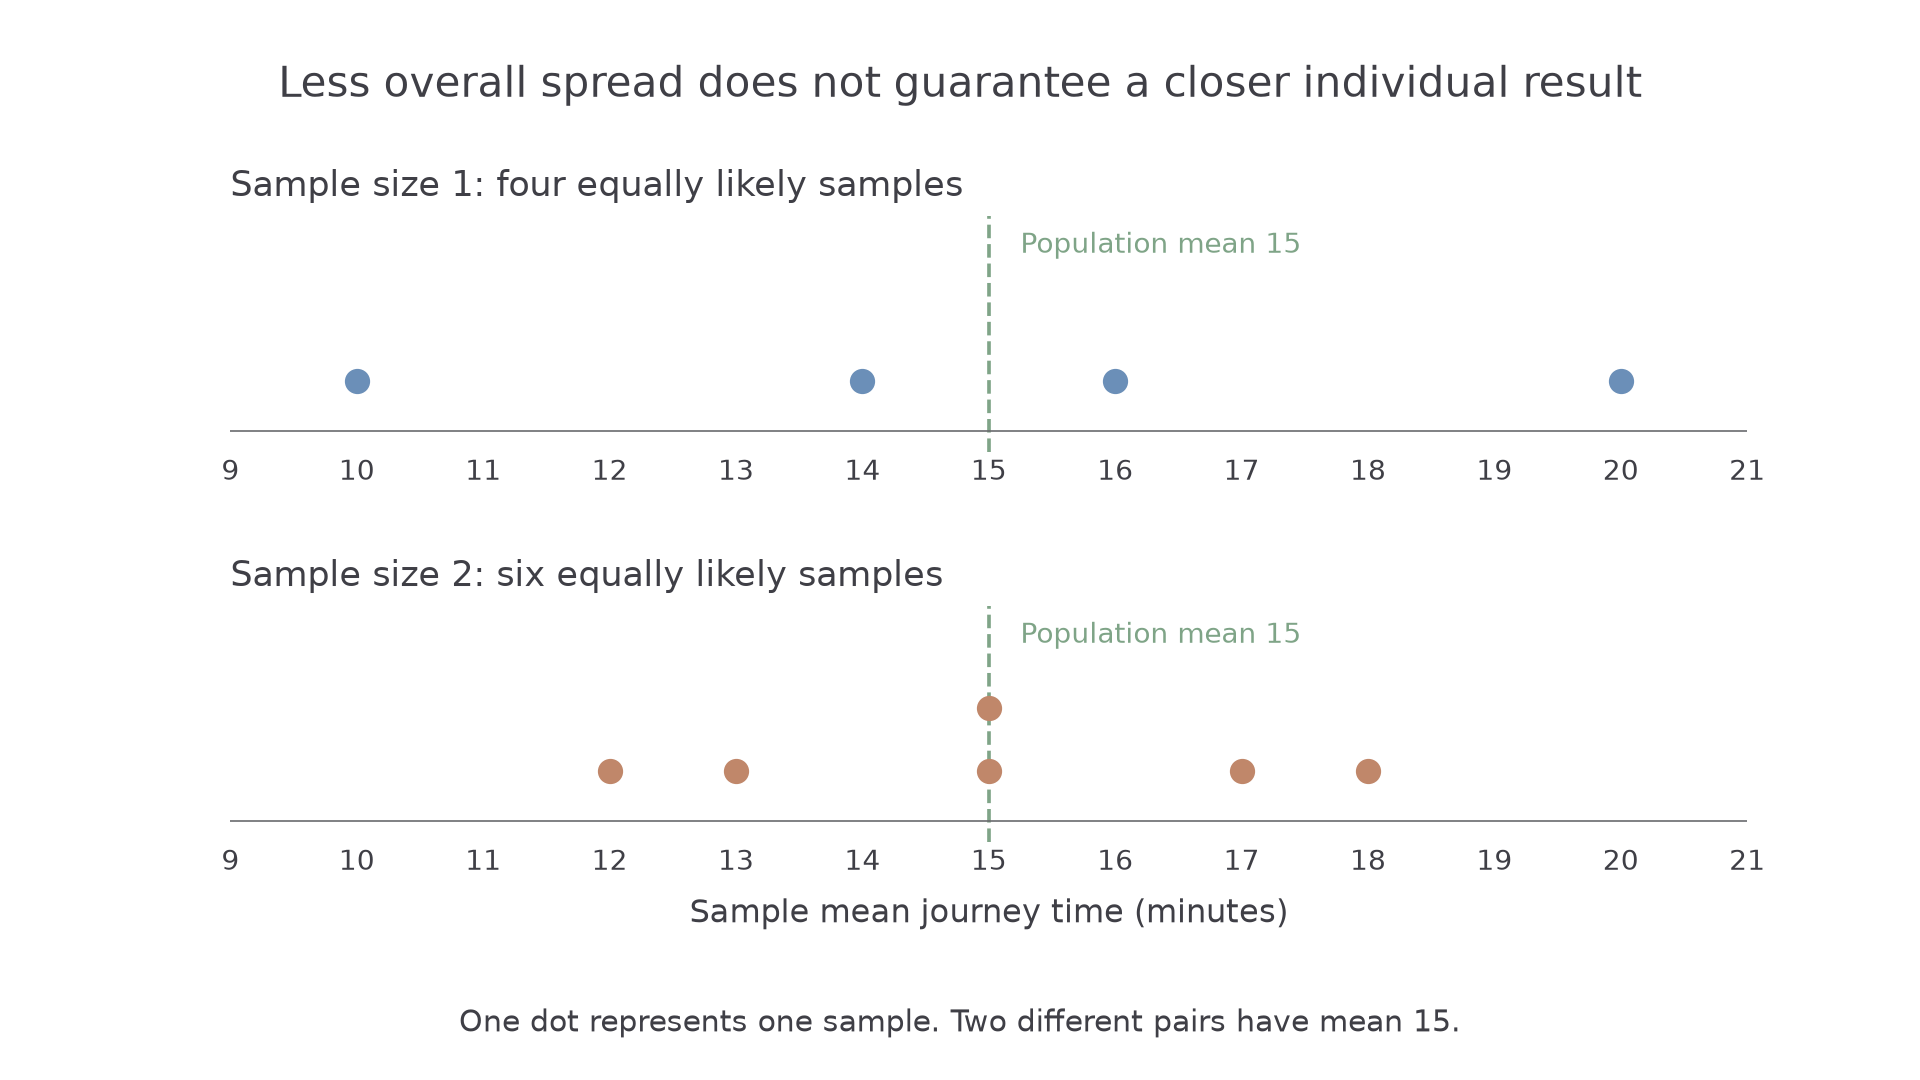
Imagine a tiny population of four journey times: minutes. Its mean is minutes. Selecting one journey at random can give any of those four values. Selecting two different journeys at random gives the six possible sample means below.
| Pair of journey times | Sample mean |
|---|---|
With all possible pairs equally likely, the possible means are less spread out than the possible single observations. Yet the pair has mean , further from than the single observation . Here is the surprise: increasing sample size improves the overall precision of this sampling process, but does not guarantee a better answer in every individual sample.
[DIAGRAM: asset_name: Larger samples and individual surprises; asset_slug: h645_b083_variation; caption: Pair means are less spread out even though one particular pair can be worse than one observation; description: Two aligned dot plots show all possible means from simple random samples without replacement from journey times ten fourteen sixteen twenty. For size one the means are ten fourteen sixteen twenty. For size two the six means are twelve thirteen fifteen fifteen seventeen eighteen, with two dots stacked at fifteen. A sage vertical line marks population mean fifteen in both panels. Each dot represents one equally likely sample within its row.]
Sampling variation and selection bias
Sampling variation is the chance difference between results from different random samples drawn using the same procedure.
Selection bias arises when the selection process systematically favours some members or outcomes in a way that distorts the population feature being investigated. It is a property of the process, rather than simply an unlucky result in one sample.
For comparable well-designed samples, more independent information generally reduces the chance variation in an estimate. It can make a small genuine effect easier to distinguish from sampling fluctuation. It also costs more time, money or destructive tests. There is no universal sample size that suits every investigation: the population's variability and the precision needed matter too.
Continue this lesson.
You’re previewing NovaLearn without an account. Create a free account to read the rest.
Create free account