SI7–SI9, SR32 - Confidence intervals for a mean
SI7 explains what confidence describes; SI8 controls interval width. SI9 and SR32 construct intervals for a single population mean using a Normal or distribution, with the sample size and knowledge of the population variance deciding which is appropriate.
Confidence belongs to the interval-producing method
How can a confidence interval miss the true mean without anything having gone wrong? The method is designed to cover the mean in about of repeated samples, not in every sample.
You already know
A sample mean estimates a fixed population mean. Its standard error describes variation between sample means. For independent Normal observations the mean is exactly Normal; for sufficiently large samples the CLT often gives an approximate Normal distribution.
For example, a method might give an interval from to . This is an interval estimate for the population mean, rather than a claim that most individual measurements fall between those limits.
Confidence interval and confidence level
A confidence interval is an interval estimate of a population parameter, calculated from a sample.
If the sampling and interval-construction process is repeated many times using independent samples, the confidence level is the long-run proportion of intervals that contain the true parameter.
The population mean stays fixed while the sample and interval change. Once one interval has been calculated, its fixed limits either contain that mean or do not. “We are confident that this interval contains the population mean” refers to the reliability of the method, not a newly random population mean.
[DIAGRAM: asset_name: Repeated confidence intervals around a fixed mean; asset_slug: h645_b103_coverage; caption: The sample intervals move while the population mean stays fixed; description: Twenty horizontal 95 percent Normal confidence intervals are drawn from independently simulated sample means, with a fixed vertical population-mean line at zero. Intervals containing zero are blue and any that miss it are clay. Each midpoint is marked. The diagram explicitly says that the number covering in twenty samples need not be nineteen.]
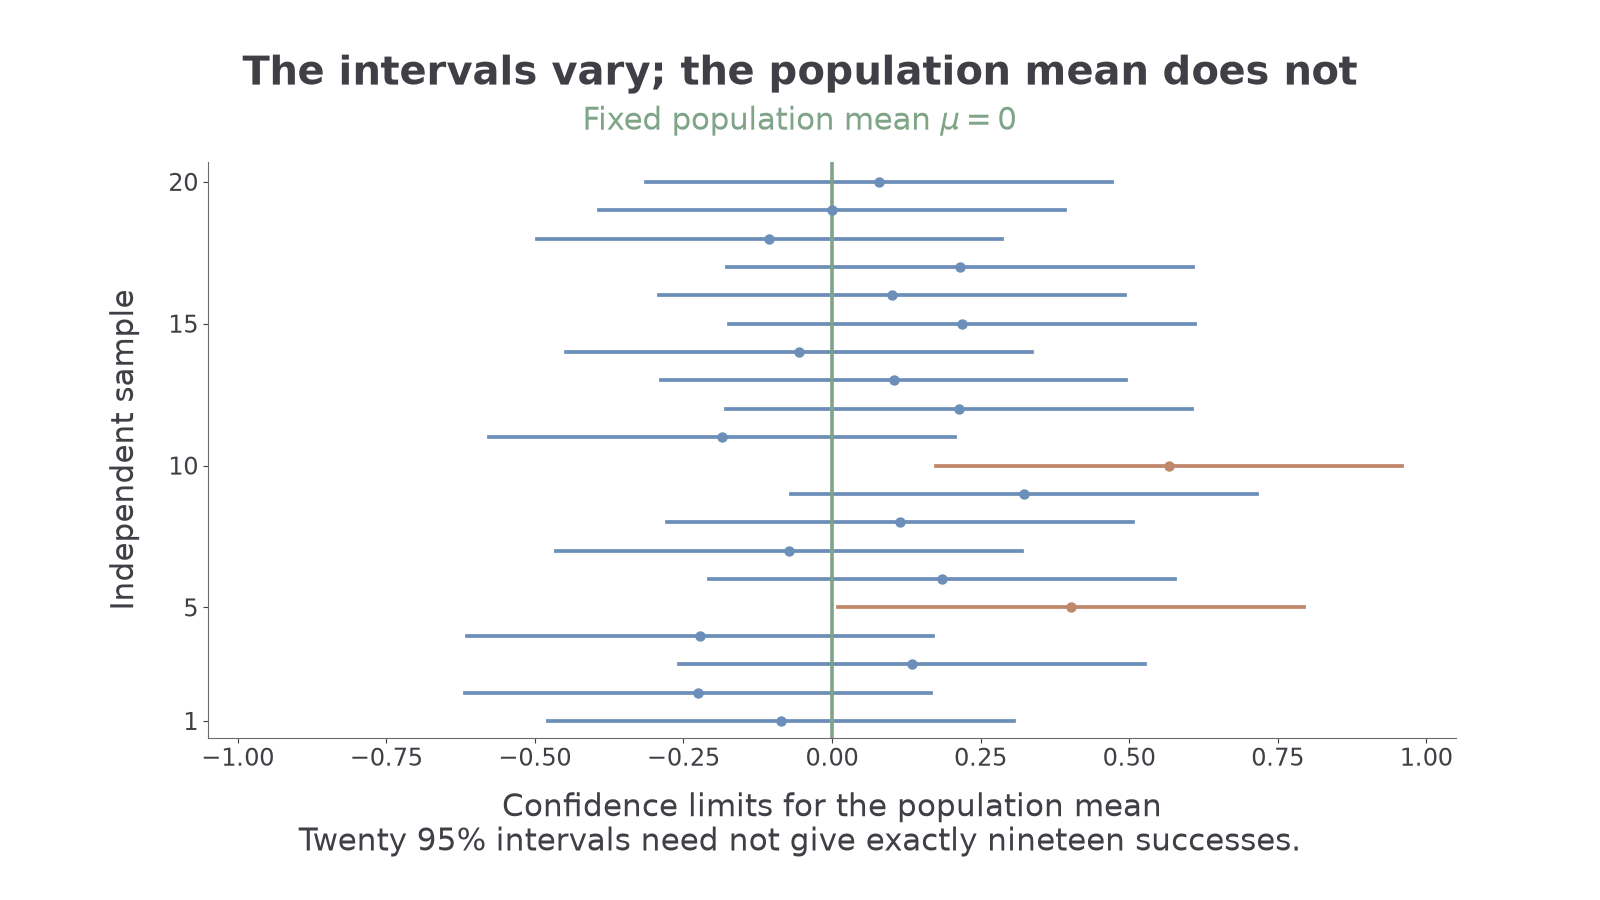
There is a useful surprise here: among independent intervals made by an exact method, the expected number covering the mean is , but the actual number need not be . An occasional miss is part of the procedure's stated behaviour.
Watch out
Wrong: “There is a chance that an individual observation lies in this confidence interval.”
Right: the interval estimates the population mean. Its confidence level describes repeated coverage of that fixed mean.
Choose the statement that keeps both the parameter and repeated-sampling idea straight.
Use a Normal critical value when it is justified
If the sampling distribution is Normal with known standard error, the middle lies within standard errors of its mean. Reversing this relation gives a symmetric interval centred on the observed sample mean.
For a small sample, this Normal construction requires an underlying Normal population and known population variance. For a large sample, use a Normal approximation, replacing by if necessary.
Normal confidence interval for a mean
A central interval is
where for .
With a sufficiently large independent sample, use when is unknown; this gives an approximate interval. For small samples use this formula only with a Normal population and known .
In the formula booklet.
The booklet's Normal table labels the total percentage outside the central interval. For confidence use the column, with in each tail: . For use , and for use .
Worked example 1: known population variance
Question. An independent random sample of measurements from a Normal population has mean . The population standard deviation is known to be . Find a confidence interval for the population mean.
Plan. Use the known standard deviation and the central Normal critical value.
Why this step? Small sample size does not force a interval when the population is Normal and its variance is known.
Answer. The confidence interval for is .
Check. It is symmetric about , with half-width standard errors.
Change only the sample size from to , with the same observed mean.
Worked example 2: a smaller standard error
Question. A sample of independent observations from the same Normal population has mean . Find its confidence interval.
Plan. Keep the critical value and population spread, but recalculate the standard error.
Why this step? Quadrupling the sample size halves the standard error and hence the interval's width.
Answer. The interval is .
Check. Its width is , half the previous width .
In a large sample with unknown population spread, the same arithmetic uses in place of . State why the Normal approximation is appropriate; do not claim that estimating the variance makes the population Normal.
Exam tip
Show the centre, critical value and standard error before giving the endpoints. A variance must be square-rooted before it is used in the standard error.
Use an estimated spread with a large sample.
Watch out
Wrong: uses the population variance as the spread. A standard error requires the standard deviation. Correct: .
Take the square root of a variance before constructing the next interval.
Continue this lesson.
You’re previewing NovaLearn without an account. Create a free account to read the rest.
Create free account