Sb1–Sb3 - Scatter diagrams
Plot paired observations, describe their pattern and interpret the extra information software puts on a scatter diagram. You will distinguish an unusual observation from a trend, and a straight-line summary from the relationship itself.
Paired data and the choice of axes
Can a scatter diagram show a perfect relationship while software reports a correlation of zero?
Yes. A correlation number can describe the wrong kind of pattern. Before trusting it, establish what each point represents and look at the picture.
You already know
A coordinate gives a horizontal and a vertical position. Keep the two measurements from the same observational unit together; a sample should represent the population you want to discuss.
For example, a pupil's revision time must stay paired with that pupil's score. Sorting the times and scores separately invents new pairs.
Bivariate data
Bivariate data contain observations of two variables on each individual or unit. Each paired observation becomes one point on a scatter diagram. The individuals need not be people: they could be springs, towns or experimental runs.
The axes depend on how the data arise:
| Situation | Horizontal axis | Vertical axis |
|---|---|---|
| An experimenter fixes loads and measures spring extensions | Controlled load, the independent variable | Measured extension, the dependent variable |
| Both measurements vary between sampled individuals | The variable naturally used to explain or predict the other | The response of interest |
The first case is random on non-random: measured responses vary at fixed input values. The second is random on random: both measurements vary across sampled individuals. Choosing height as the horizontal variable does not turn sampled heights into controlled constants.
Key idea
One point represents one genuine pair; put a controlled independent variable on the horizontal axis and label both axes with units.
Check both the pairing and the axis choice.
Patterns and unusual points
Describe a cloud by its direction, shape and strength, then look for observations that do not fit it.
Positive association means that larger values of one variable tend to accompany larger values of the other; negative association reverses that tendency. A monotonic pattern keeps an overall increasing or decreasing direction. A linear pattern is approximately straight. A curve can be monotonic without being linear.
Outlier
An outlier is an observation unusually far from the main pattern of the data. Identify it relative to the other points and the context. A single point does not itself have a positive or negative correlation.
The diagrams use a small invented set to make each change visible. Real samples usually have more scatter.
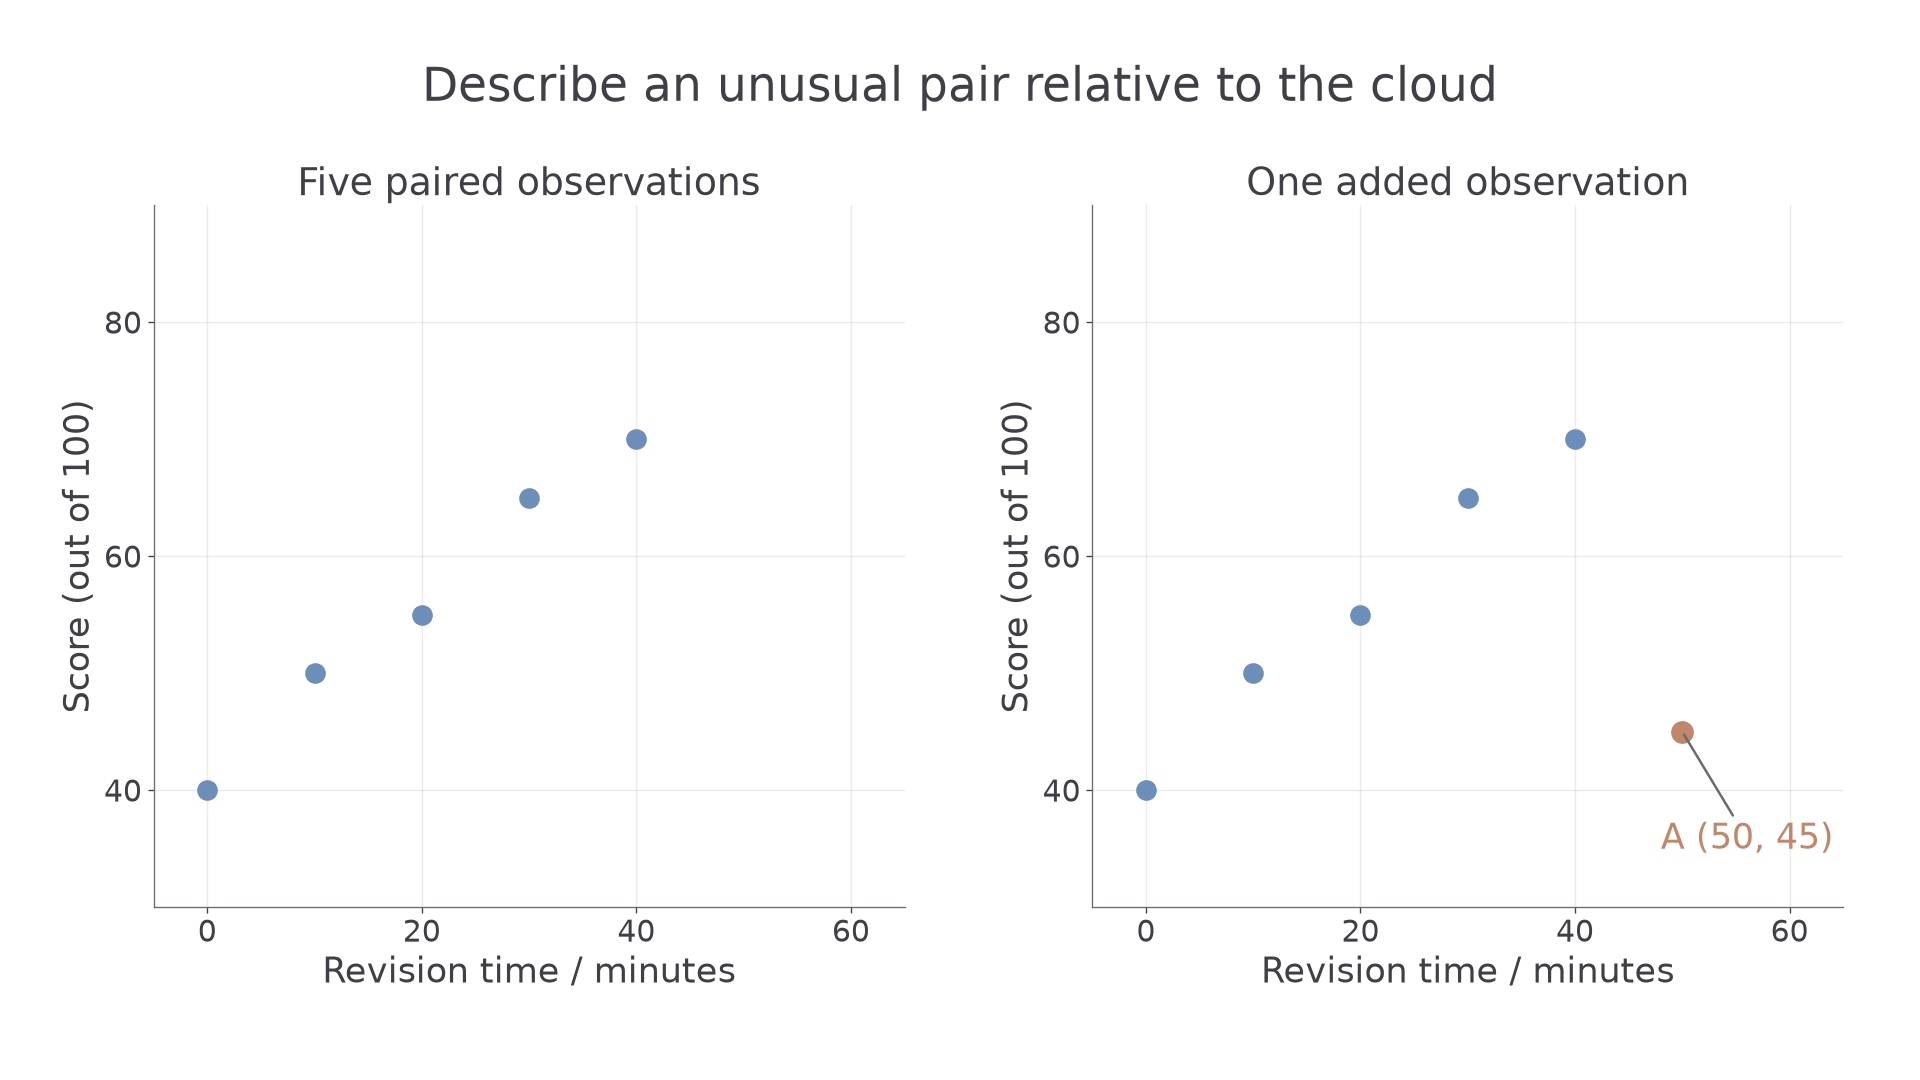
[DIAGRAM: asset_name: A new point changes the scatter picture; asset_slug: scatter_added_outlier; caption: A lies below the score expected from the main increasing pattern; description: Two panels plot revision minutes horizontally and score out of 100 vertically. Both contain the blue points (0,40), (10,50), (20,55), (30,65), (40,70). The right panel adds a clay point A at (50,45). The axes share the same scales and the added point is clearly labelled A, with no fitted line. The main five points form an approximately linear increasing pattern.]
Worked example 1: describing the original cloud
Question. Describe the relationship in the left-hand diagram, which plots revision minutes and score .
Plan. Follow the cloud from left to right, then comment on its shape and scatter in context.
The points lie close to an increasing straight-line pattern.
Why this step? Direction alone is incomplete: a tight increasing curve and a loose increasing line are different pictures.
Answer. There is a strong positive, approximately linear association: pupils with longer revision times tend to have higher scores.
Check. All five paired scores increase with time, and none lies conspicuously away from the main pattern.
Now change only the data set by adding one labelled observation.
Worked example 2: describing an outlier correctly
Question. Point is added in the right-hand diagram. Describe how it differs from the main pattern and explain whether it should automatically be deleted.
Plan. Compare its score with scores at similar or shorter revision times, then distinguish unusual data from an established error.
Why this step? The relevant feature is an unexpectedly low score for a long revision time. Calling “negative correlation” would assign a trend to one point.
Answer. is a possible outlier below the main increasing pattern. Investigate its measurement and circumstances; its being unusual alone does not justify deletion.
Check. The score is not exceptionally low in isolation. It is the combination with minutes that makes the point unusual.
Continue this lesson.
You’re previewing NovaLearn without an account. Create a free account to read the rest.
Create free account