SI10, SI11 - Confidence intervals for paired samples
SI10 identifies a genuine pairing between observations. SI11 then treats the differences as one sample, constructing a Normal or confidence interval for the mean difference and interpreting its sign in context.
Keep the links between observations
Can changing the pairing change an interval even when both sample means stay the same? Yes. The mean difference stays fixed, but the variability of the differences can change dramatically.
Suppose two objects give readings on instrument A and on instrument B. Correctly matching the same objects gives differences . Swapping the B readings gives differences . Both lists average , but the second is much more variable. The identities of the objects carry information that two separate lists lose.
Paired observations
Observations are paired when each value in one sample has a meaningful link to one particular value in the other: for example, the same object measured by two instruments, or the same person measured before and after an intervention.
Pairs may also be deliberately matched on relevant characteristics. Two unrelated samples do not become paired merely because they have equal sizes.
Work with one difference per pair, using the same subtraction order throughout. Independence is needed between pairs; dependence within a pair is exactly why retaining the link is useful.
If , its population mean is
by the expectation rule. An interval for therefore estimates the difference in the two population means, using the paired design.
[DIAGRAM: asset_name: A paired study retains object identity; asset_slug: h645_b104_pairs; caption: Follow each object's two readings instead of treating the columns as unrelated samples; description: A paired dot plot joins readings on instrument A to instrument B for six labelled workpieces. A separate panel lists the six B-minus-A differences one, two, three, four, five and three grams. The broad range of workpiece masses is distinguished from the smaller within-workpiece changes.]
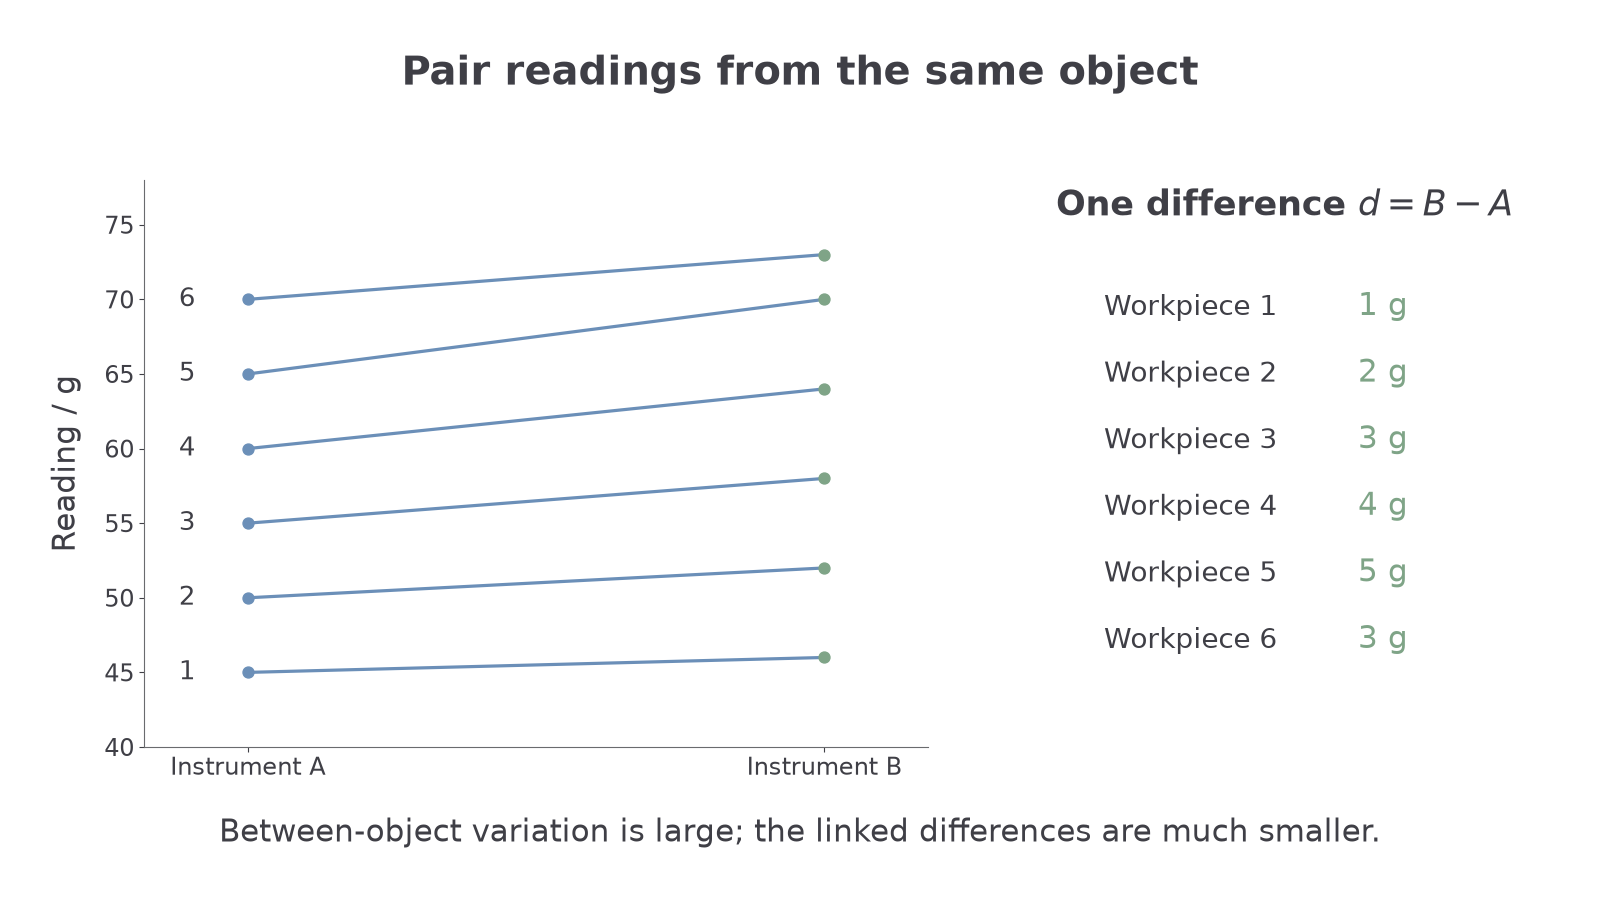
Pairing controls variation between objects, but it does not automatically remove other biases. Measuring every object on A first and B later could confound the instrument difference with a time effect; varying the order can help control that.
Watch out
Wrong: sort both columns and pair equal ranks just because the lists have the same length.
Right: preserve the pairing justified by the study design. A convenient arrangement is not evidence of a real link.
Identify the study with a genuine paired structure.
Make the differences your single sample
You already know
For a small independent sample from a Normal population with unknown variance, the mean interval is . For paired data, apply this to the differences, not to the two columns separately.
Six workpieces are measured on two instruments, in grams:
| Workpiece | A | B | |
|---|---|---|---|
The sample size for inference is pairs, not readings. The required small-sample assumption is that the population of differences is Normal. Neither original column needs its own separate Normal assumption for this calculation.
Confidence interval from paired differences
Calculate
For independent pairs with an underlying Normal distribution of differences and unknown difference variance, use
For a large paired sample, use the Normal approximation with estimated standard error .
In the formula booklet.
The booklet directs you to treat paired differences as a single distribution, and supplies the sample variance and mean-interval formulae. A known population variance of differences is not required in this course's examined paired-sample cases.
Worked example 1: a small paired sample
Question. For the six workpieces above, find a confidence interval for the population mean difference B minus A. Assume independent pairs and a Normal population of differences.
Plan. Estimate the mean and variance of the differences, then use .
Why this step? The variance of the differences already reflects how the readings are linked. Separate column variances would discard that information.
Answer. Approximately for the population mean B-minus-A difference.
Check. Positive values correspond to B tending to read higher than A, consistent with the defined subtraction order.
Change only the direction of subtraction, from B minus A to A minus B.
Continue this lesson.
You’re previewing NovaLearn without an account. Create a free account to read the rest.
Create free account