7.05d, 7.05e - Float, cascade charts and scheduling
Use a project's early and late event times to find activity timings, independent float and interfering float in 7.05d. In 7.05e, turn the network into a cascade chart, investigate delays, and construct schedules which obey both dependencies and worker restrictions.
Activity start and finish times
A gallery's project takes hours with enough workers. Making signs has hours of total float, and preparing the room has . Can both activities use all their float together, and can two workers still finish on time? Spare time has a structure: knowing its total is only the beginning.
You already know
For an activity , is the earliest time of its start event and is the latest time of its finish event. With duration , total float is . Forward and backward passes include all dummy arcs.
Use the gallery project from the preceding lesson. All durations are in hours.
| Activity | Arc | Immediate predecessors | Duration |
|---|---|---|---|
| none | |||
| none | |||
| dummy | |||
The earliest event times are ; the latest event times are . An event time need not equal the finishing time of every activity entering it: can finish at time , while event waits until finishes at time .
The four activity times
For an activity with duration ,
These latest times preserve the project deadline used in the backward pass, before any additional resource restriction.
Not in the formula booklet: learn it.
Add the duration when moving forward from a start, and subtract it when moving backwards from a finish.
Worked example 1: an activity finishes before its end event
Question. Find the earliest finish and latest start of in the original gallery project.
Plan. Use the early time at event for its earliest finish and the late time at event for its latest start.
Why this step? Event 's early time includes waiting for . It is not the earliest possible finish of .
Answer. can finish as early as time , or start as late as time , while preserving the -hour project completion time.
Check. The latest start minus earliest start is , its total float.
Worked example 2 changes only 's duration to hours. Both ends of its allowed interval remain fixed, so the earliest finish moves later and the latest start moves earlier.
Worked example 2: a longer activity has a smaller window
Question. With lasting hours and all other gallery data unchanged, find its earliest finish and latest start.
Plan. Check that the minimum project time stays , then apply the two timing calculations with the new duration.
Why this step? The activity's earliest finish is still , even though the finish event occurs at time .
Answer. Earliest finish ; latest start .
Check. The start window has length , agreeing with hour of total float.
The four times refer to one activity, not four different positions on the network.
Watch out
Wrong: earliest finish of is . At a merge, another activity can determine . Right: its earliest finish is ; its latest finish is .
Now shorten the duration slightly and calculate the window again.
Independent and interfering float
Some spare time is guaranteed even when the preceding work finishes late and the following work is due to start early.
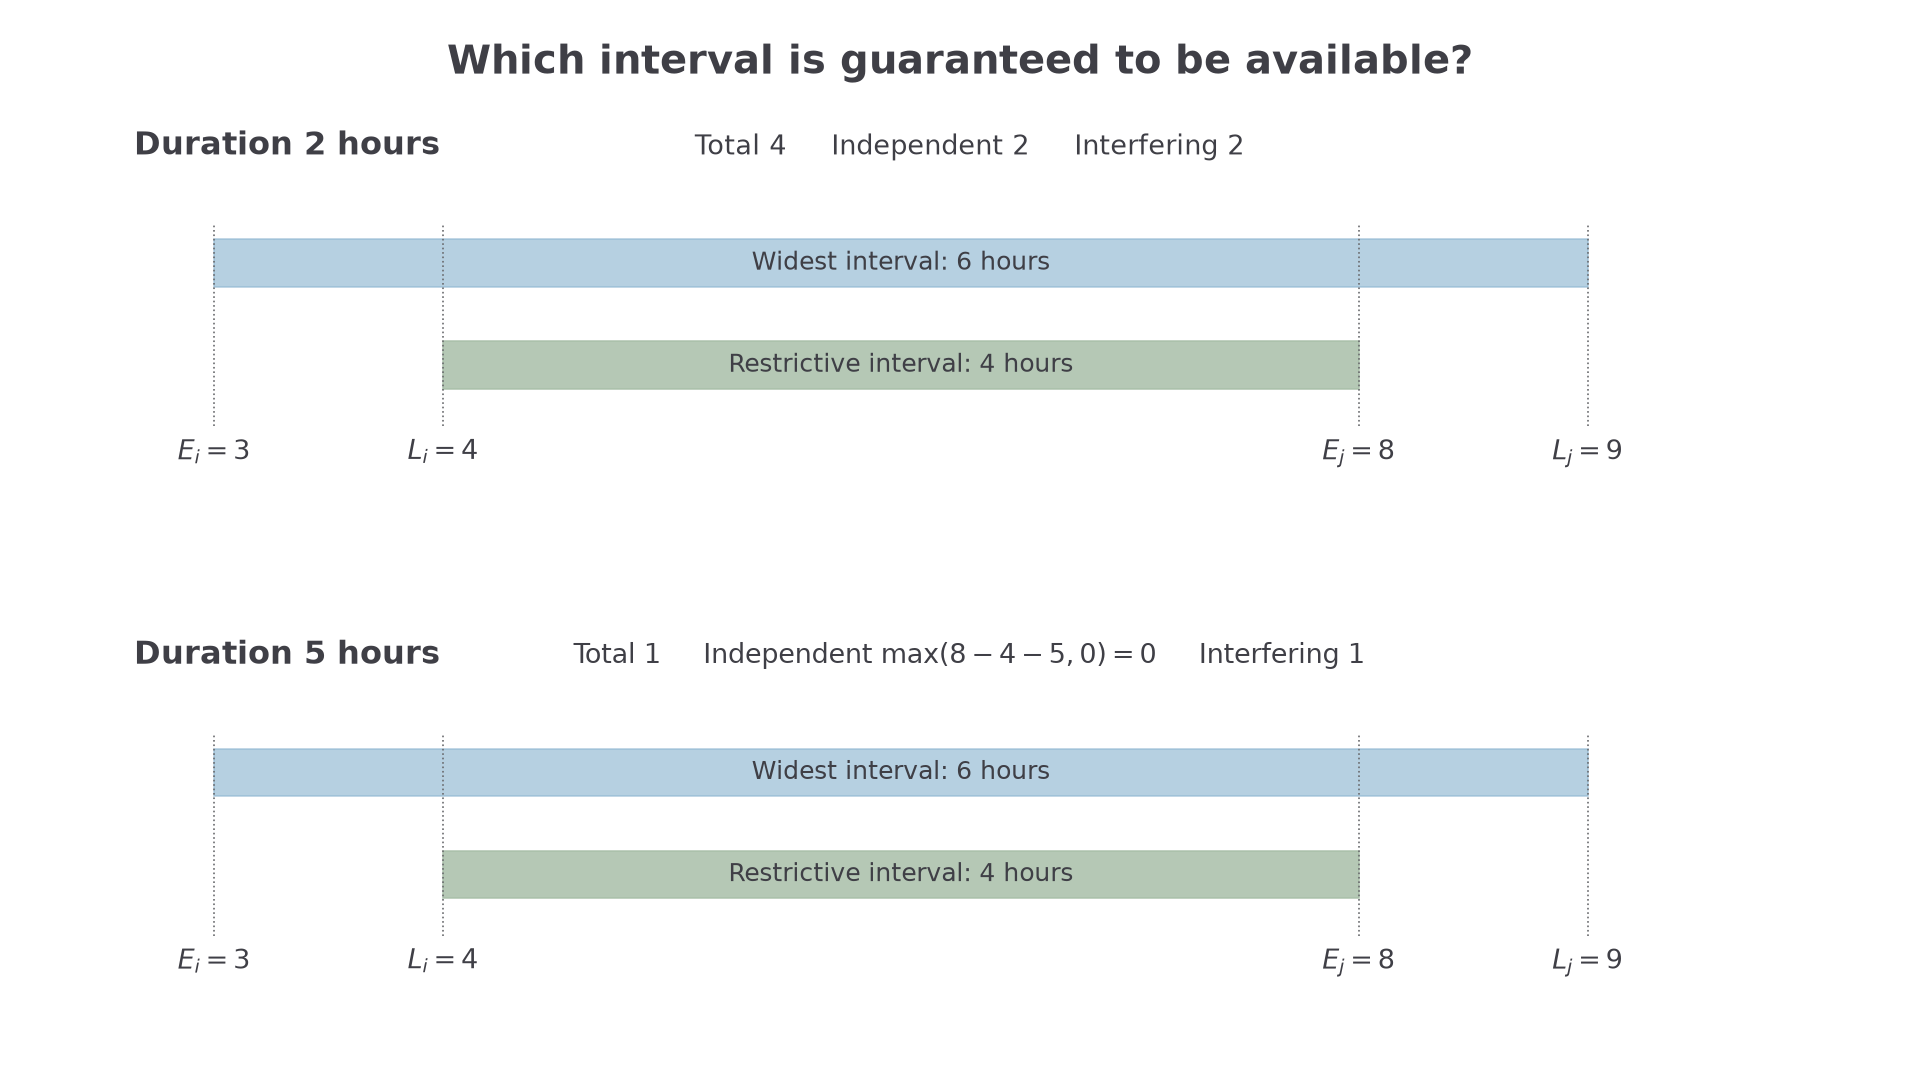
For activity , imagine that its start event occurs at its latest time , while its finish event must still occur at its earliest time . The available interval is then . Whatever is left after its duration is independent float. If it cannot fit into that interval, its independent float is , not a negative number.
Independent and interfering float
Independent float is the amount by which an activity's duration can increase without affecting preceding or succeeding activities, even when preceding events occur as late as permitted and succeeding events occur as early as possible. Interfering float is the rest of its total float: using it can affect the timing available to other activities, although the project deadline can still be met. For example, total float and independent float give interfering float .
Total float uses the widest interval, from the earliest start event to the latest finish event. Independent float uses the more restrictive interval between the latest start event and earliest finish event.
Splitting total float
For activity of duration ,
The event times come from forward and backward passes for the same project deadline. All floats are non-negative for a feasible project with that deadline.
Not in the formula booklet: learn it.
The maximum with is part of the formula, not an optional adjustment. Show and label the total and independent floats before subtracting them.
Worked example 3: some float is independent
Question. Activity has duration hours. Its event times are , , , . Calculate its total, independent and interfering floats.
Plan. Calculate the widest spare interval first, then the spare interval between and , and subtract.
Why this step? Even starting at time , can take hours and still finish at time . Its duration can therefore increase from to without disturbing either neighbouring event time.
Answer. Total float hours; independent float hours; interfering float hours.
Check. Independent plus interfering is , equal to the total.
Worked example 4 changes only 's duration to hours, with the same event times. The restrictive interval is now too short, even though the activity remains feasible within the wider interval.
Worked example 4: independent float cannot be negative
Question. Activity now takes hours. Its event times remain , , , . Calculate all three floats.
Plan. Repeat the calculations and replace a negative value inside the independent-float maximum by .
Why this step? A negative intermediate value says there is no guaranteed spare time under both restrictive event choices. It does not mean the activity has negative independent float or that the project is impossible.
Answer. Total float hour; independent float ; interfering float hour.
Check. Starting at time finishes at time ; starting at time finishes at time . Both fit the project, but the later start cannot preserve the earlier finish event.
The narrower time interval is visible between the two middle event-time bounds.
[DIAGRAM: asset_name: The two intervals behind float; asset_slug: h245_7_05_float_windows; caption: Independent float uses the interval from the latest start event to the earliest finish event. A negative remainder is replaced by zero; description: Two horizontal timing panels for activity P, with E_i=3, L_i=4, E_j=8, L_j=9 on a common scale. A pale blue wider interval runs from 3 to 9 and a green restrictive interval from 4 to 8. The top panel shows duration 2, total float 4, independent float 2 and interfering float 2. The bottom shows duration 5, total float 1, independent float 0 and interfering float 1, with the calculation max(8-4-5,0)=0]
Label each answer: three unlabelled numbers do not show which type of float you have calculated.
Watch out
Wrong: independent float , then interfering float . Right: independent float , then interfering float . Apply the maximum before calculating the interfering float.
Choose the two event-time bounds carefully in the next calculation.
Constructing cascade charts
A cascade chart shows the activity durations and their available float on a time axis, making parallel work and spare intervals easy to see.
For the original gallery project, place each activity's solid bar at its earliest start. Continue with a dashed segment from its earliest finish to its latest finish, if these differ. That dashed length is its total float. You may give every activity its own row, or put the critical activities together on one row and each non-critical activity on a separate row; follow the layout requested in the question.
Cascade chart
A cascade chart is a time-scaled display of activities, usually with each activity starting at its earliest start time. A solid bar shows its duration and a dashed extension can show its total float. For example, 's solid bar from time to and dashed extension from to show duration and total float . The row represents an activity, not a worker.
The bar must end at earliest start plus duration, while the dashed extension ends at latest finish. Dummy activities have no duration to draw as a solid bar, but their dependencies remain part of the timing calculations.
Worked example 5: putting durations and float on a time axis
Question. Construct a cascade chart for the original gallery project, starting activities at their earliest times and showing total float with dashed lines.
Plan. List each solid interval and dashed extension, then draw them to the same time scale.
Why this step? Drawing from time to time as a solid bar would turn its hours of float into fictitious work. Separate work from available time.
Answer. The upper chart below has these five solid bars and the two dashed extensions.
Check. Solid lengths are , while dashed lengths are . The last activity finishes at time .
Worked example 6 changes only 's duration from to hours. Its bar gets longer and its dashed extension gets shorter.
Worked example 6: changing the split between work and float
Question. Construct the cascade chart when takes hours and all other gallery data are unchanged.
Plan. Keep the unchanged activity bars, and redraw using its new earliest finish and remaining float.
Why this step? The total interval has not changed. Its allocation between work and float has.
Answer. Use the lower chart below: only 's solid/dashed boundary changes.
Check. The new solid length is and the dashed length is , agreeing with the recalculated float.
A common axis makes the change directly comparable.
Continue this lesson.
You’re previewing NovaLearn without an account. Create a free account to read the rest.
Create free account