5.08e–5.08g - Rank correlation and choosing a coefficient
Calculate Spearman's rank correlation coefficient and use it to describe agreement or disagreement between two orderings. You will test for association in a population, choose the correct critical-value column, and decide when ranks or Pearson's straight-line measure answer the question you actually want to ask.
Calculating Spearman's coefficient
Two measurements can rise together perfectly without lying on a straight line. For the pairs , , , , , each increase in the first measurement accompanies an increase in the second, yet Pearson's coefficient is about , rather than . Can a correlation coefficient recognise perfect agreement in order even when the curve bends?
Replace the measurements by their positions in their respective ordered lists. The increasing values of both variables then receive ranks . The distances between the measurements have disappeared, leaving complete agreement between the two orderings.
You already know
Pearson's measures closeness to a straight line using the numerical measurements. Hypothesis tests concern a population, with the direction of the alternative chosen from the claim. Failing to reject a null hypothesis is not proof that it is true.
When data consist of positions or ratings with a meaningful order but no meaningful numerical spacing, ranking is useful in its own right. The gap between first and second place need not mean the same thing as the gap between second and third.
Spearman's rank correlation coefficient
Spearman's rank correlation coefficient, , measures the agreement between the ranks of paired observations. Rank each variable separately, using a consistent direction, and let be the difference between the two ranks for the same individual. With no tied values, each rank list uses every integer from to once.
Use rank for the smallest value of each variable unless the context already supplies ranks, such as first place in a race. The method below assumes there are no ties: two equal values cannot be assigned two distinct ordered positions by guessing. We will use distinct values throughout.
Spearman's rank correlation coefficient
For paired observations with no tied ranks,
Here is the difference between the two ranks in pair . We will calculate the coefficient for at most pairs.
In the formula booklet.
Make a table containing both ranks, their difference and its square. The sign chosen for does not matter after squaring, but the pairing does: each row must still represent the same individual.
Worked example 1: measurements converted to ranks
Question. Six samples have the following paired measurements. Calculate Spearman's rank correlation coefficient.
| Sample | A | B | C | D | E | F |
|---|---|---|---|---|---|---|
Plan. Rank the two measurement lists from smallest to largest, preserve the sample labels and sum the squared rank differences.
| Sample | Rank of | Rank of | ||
|---|---|---|---|---|
| A | ||||
| B | ||||
| C | ||||
| D | ||||
| E | ||||
| F |
Why this step? Sample E has the fifth rank but the third rank; sorting columns independently would erase exactly the disagreement being measured.
Answer. , to significant figures. The ranks show positive association, but do not agree perfectly.
Check. Each rank column sums to , and .
Worked example 2 changes only the gaps between the measurements. Their order is preserved, so a rank-based coefficient should stay the same.
Worked example 2: different gaps, the same ordering
Question. Keep the six values from example 1, but replace the measurements for samples A to F by . Calculate Spearman's coefficient.
Plan. Check the new order, then use the rank differences rather than differences between the measurements.
Why this step? Spearman's coefficient deliberately discards the size of the measurement gaps. The larger gap from to cannot matter when the order has not changed.
Answer. , to significant figures, unchanged.
Check. The rank columns are identical to those in example 1, so every is identical as well.
The formula depends on squared differences, not a squared total difference.
Watch out
Wrong: replace by . In example 1 the differences sum to zero, but their squares sum to . Right: square each row's difference before adding.
Now begin with two lists of ranks already supplied.
What rank correlation does and does not say
Rank correlation describes an ordering relationship, so it can recognise an increasing curve as well as an increasing straight line.
Monotonic association
A monotonic relationship keeps the same direction of change: as one variable increases, the other consistently increases, or consistently decreases. With distinct values, perfect agreement between the two increasing orders gives ; perfectly reversed orders give .
The opening data lie on the increasing curve . Their two increasing rank lists are identical, so every is zero and . That answers the opening question: perfect agreement of order can be recognised without insisting on a straight line. Pearson's and Spearman's are measuring different features of the same points.
[DIAGRAM: asset_name: Straightness versus ordering; asset_slug: h245_5_08_rank_shapes; caption: An increasing curve has perfect rank agreement, while an exact U-shaped relationship changes direction and is not summarised well by a single rank coefficient; description: Left panel plots the five points (1,1), (2,2), (3,4), (4,8), (5,16), with a smooth increasing exponential guide and labels giving x ranks and y ranks both 1 to 5, rs = 1 and r approximately 0.933. Right panel plots x values -3, -1, 0, 2, 4 and y values 9, 1, 0, 4, 16 with a smooth parabola guide, labels the falling and rising sections, and states that the association changes direction. All values are distinct within each variable, so no tied ranks occur.]
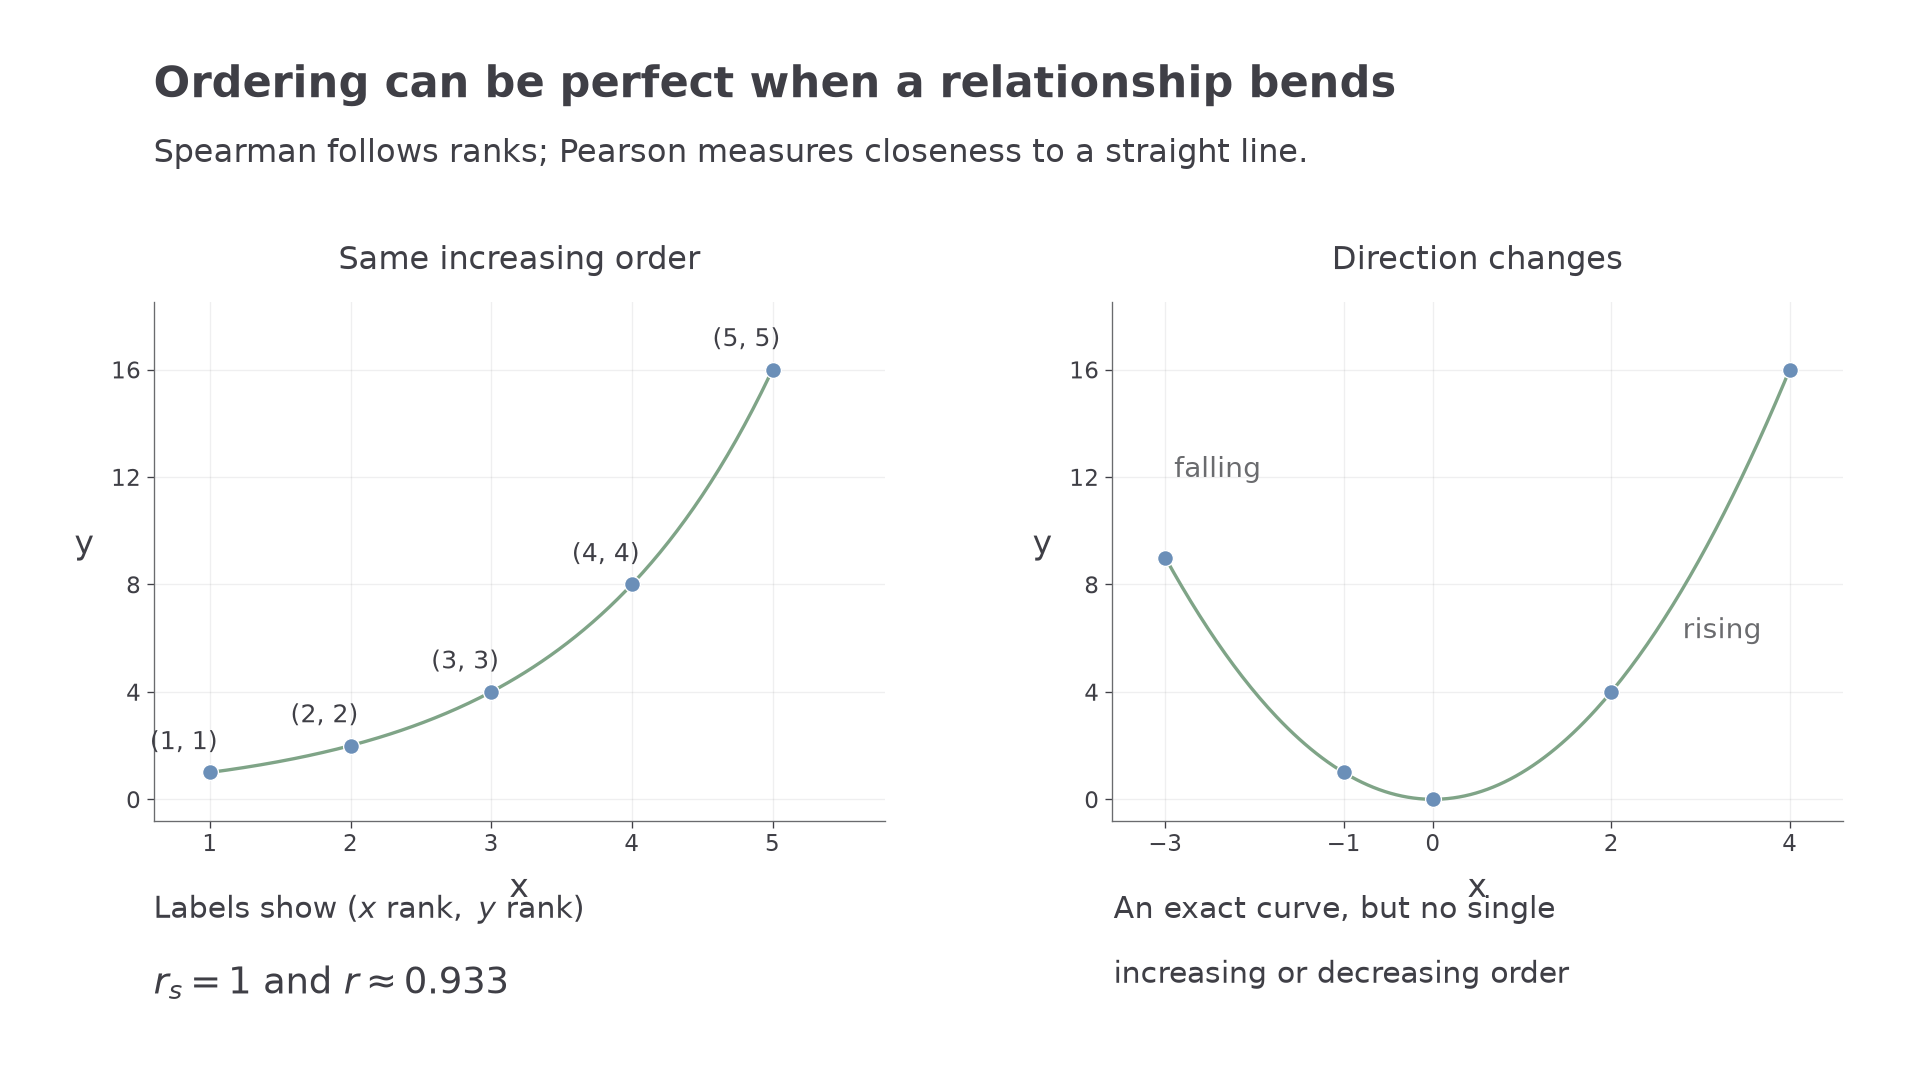
If the relationship changes direction, neither a single increasing nor a single decreasing ordering captures it. A coefficient near zero need not mean that the variables are unrelated. A scatter diagram remains useful even after the ranks have been calculated.
There is another surprise when the sample is tiny. With three distinct pairs, fix one rank list as . The other list has only six possible orders:
| Other rank list | ||
|---|---|---|
The denominator is , so these six permutations produce only four coefficient values. Listing all permutations matters if you are asked to show that no other values are possible. The range from to does not mean every value in that interval is attainable for a fixed sample size.
When ranking, decide what the two directions mean in context. Giving rank to the best performer in both races measures agreement about performance. Reversing both rank lists keeps agreement unchanged. Reversing only one turns agreement into disagreement; it does not provide an alternative answer to the same question. A positive rank coefficient alone also establishes no causal mechanism.
Key idea
Spearman's coefficient measures agreement of order, not straightness, equality of the measurements or causation. Keep the meaning of each ordering visible.
Check a proposed shortcut before accepting its result.
Continue this lesson.
You’re previewing NovaLearn without an account. Create a free account to read the rest.
Create free account