5.03a–5.03d - Probability density, mean and variance
A continuous measurement assigns probability to intervals rather than individual values. In 5.03a–5.03b you will turn a density curve, including a piecewise curve, into probabilities; 5.03c–5.03d then use the same areas to find means, variances and expected values of functions.
Density and probability
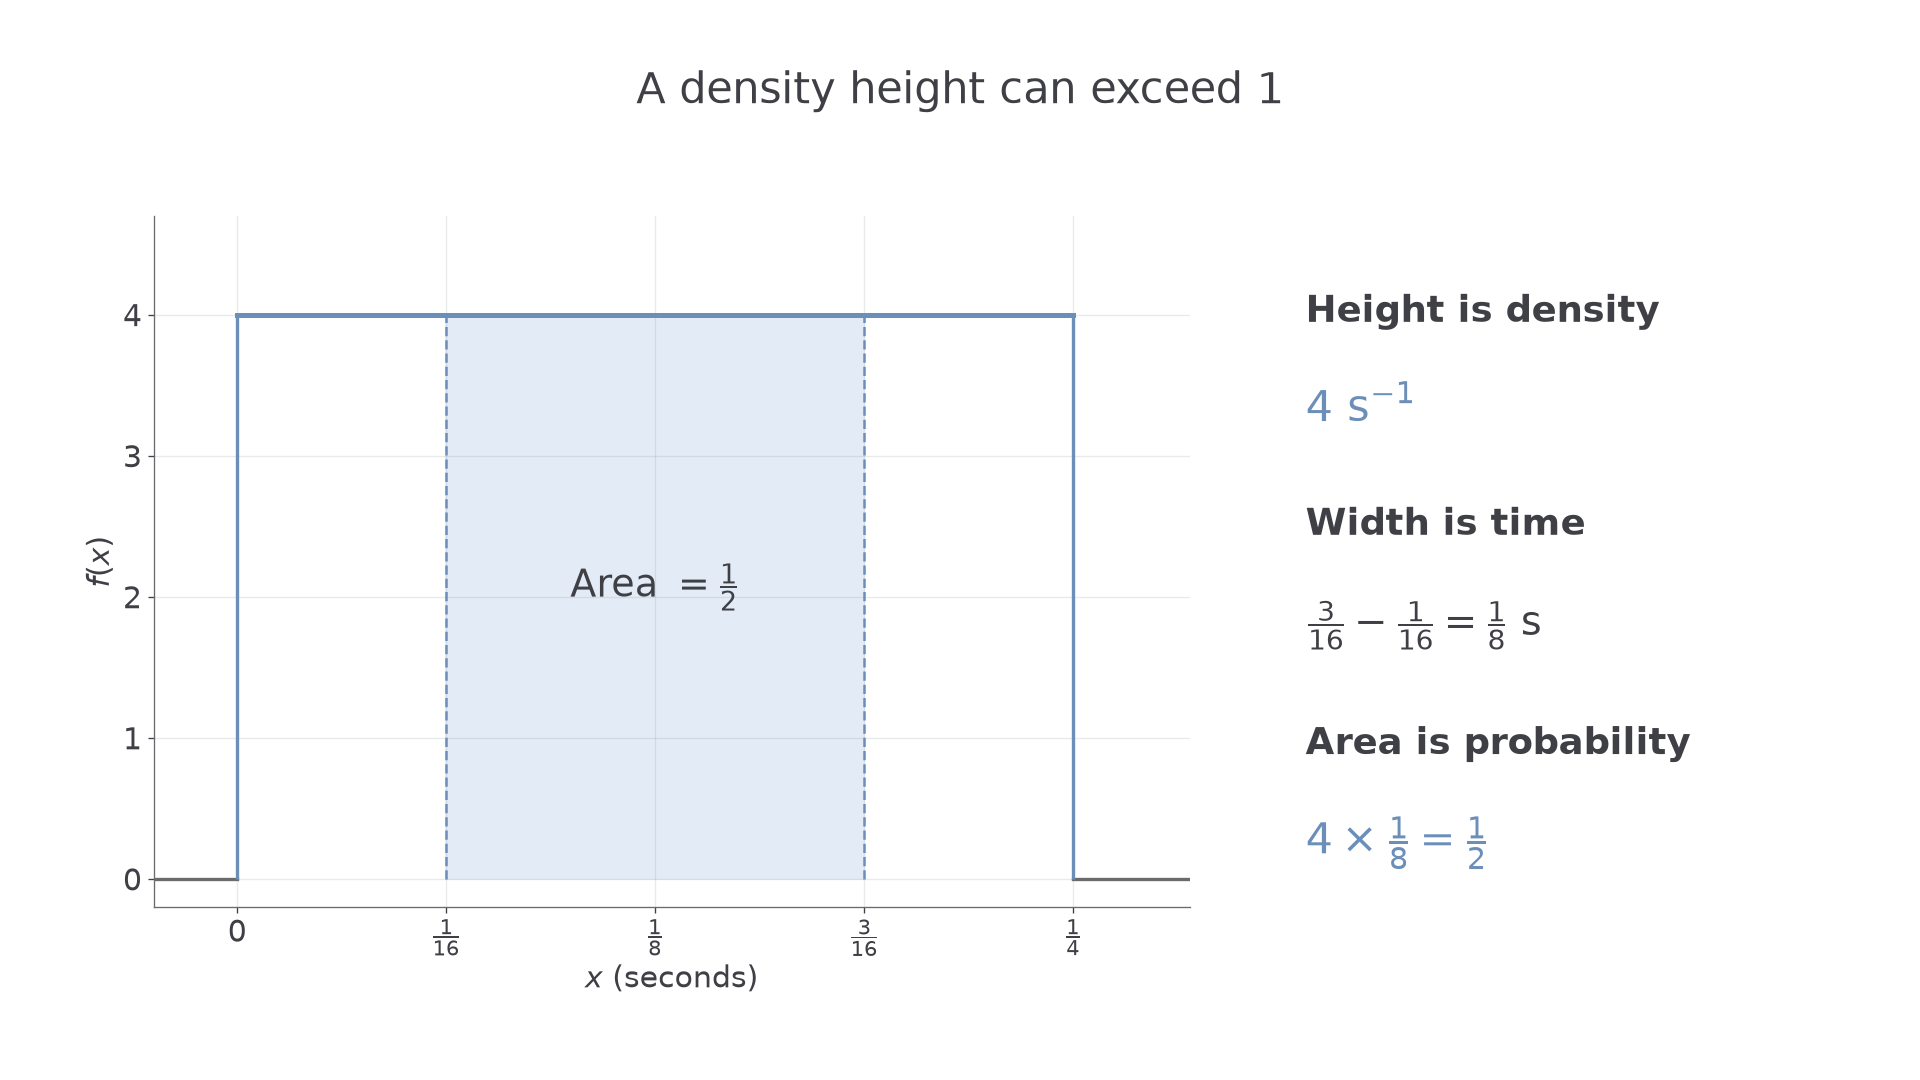
Can the height of a probability density curve be greater than , even though a probability cannot? Imagine a timer whose reading , in seconds, lies between and , with equal probability in equal-length intervals. The rectangle under its density must have area , so its height is . A height of is perfectly sensible: a probability of is not.
You already know
For a discrete random variable, probabilities are attached to possible values and add to . A definite integral gives signed area; when the integrand is non-negative, it gives ordinary area. Expectation is a probability-weighted average.
Measurements such as a waiting time or a length are modelled on a continuous scale. The model may allow every value in an interval even when the measuring instrument rounds its display. A rounded reading of represents an interval, not the event that the underlying measurement is exactly .
[DIAGRAM: asset_name: Density height is not probability; asset_slug: h245_5_03_density_height; caption: A rectangle of height 4 and width one quarter has total area 1, while an interval of width one eighth has probability one half; description: Density graph on white axes with x in seconds. The density equals 4 from x equals 0 to x equals one quarter and zero elsewhere. A pale blue strip from one sixteenth to three sixteenths has width one eighth, height 4 and area one half. A side panel distinguishes density 4 per second from probability one half]
Continuous random variable and probability density
A continuous random variable has a probability density function when probabilities are given by areas:
The density satisfies for every , and its total area is . The support is the set of values on which the distribution is concentrated, usually described by the intervals where its density can be positive. For example, the timer has support . A function with a negative section is not a valid p.d.f., even if its total signed integral is .
For a very short interval of width , the probability is approximately , provided the density varies little across the interval. Shrinking the interval to a single point leaves area zero. Thus , and including or excluding a single endpoint does not change any probability. This does not say that no value occurs: one value occurs on each trial, but no preselected exact value has positive probability.
A density carries reciprocal units: if is in seconds, is in . Multiplying by a width in seconds gives a probability with no units. Altering a density at a finite number of individual points also leaves all probabilities unchanged.
Key idea
Density is height; probability is area. A continuous point has probability zero, while an interval can have positive probability.
The timer's density gives , exactly the shaded area. Use that distinction in the diagnostic question.
Validating a density
To determine an unknown constant in a density, make its total area equal to , then check non-negativity on the whole support.
Conditions for a p.d.f.
A valid probability density satisfies
On finite or piecewise support, add the integrals over all the relevant intervals.
These conditions are not printed as a separate result in the booklet.
Not in the formula booklet: learn it.
Both conditions matter. A signed integral can equal even when the graph dips below the axis, and a non-negative curve can have the wrong total area. The first example keeps these two jobs separate.
Worked example 1: a normalising constant
Question. The function for , and otherwise, is a probability density. Determine .
Plan. Integrate on the stated support, set the area equal to , and check the sign.
Why this step? The limits come from the support; integrating over all real values adds only zero outside it.
Answer. . Then on , and it is zero elsewhere, so both conditions hold.
Check. The graph is a triangle of base and height , with area .
Worked example 2 changes one feature: the density has two pieces. The constant must normalise their combined area, rather than making each piece have area .
Worked example 2: two pieces share one total
Question. Determine so that
is a valid probability density.
Plan. Add the two area integrals and check each piece is non-negative.
Why this step? There is one random variable and one unit of probability, shared between the two intervals.
Answer. . On the first interval ; on the second . The density is therefore non-negative everywhere, with total area .
Check. The two pieces form a triangle of base and height , again giving area . Each half has probability .
The sign check is short, but it establishes something integration alone cannot establish.
Watch out
Wrong: “, so is a valid density.” An indefinite integral is not a total area, and area alone is insufficient. Right: use definite limits covering the support and also state throughout.
In a “show that this is a valid p.d.f.” question, write both conditions explicitly. For a piecewise function, inspect every branch, including the zero branch.
Interval probabilities
An event chooses the area you need; the formula for the density tells you how to calculate it.
Probabilities from a density
For a continuous variable with p.d.f. ,
The same value applies with either or both inequalities strict. Restrict the integral to the support, and split it wherever the expression for changes.
The booklet gives the c.d.f. integral, from which this result follows, but does not print this interval rule separately.
Not in the formula booklet: learn it.
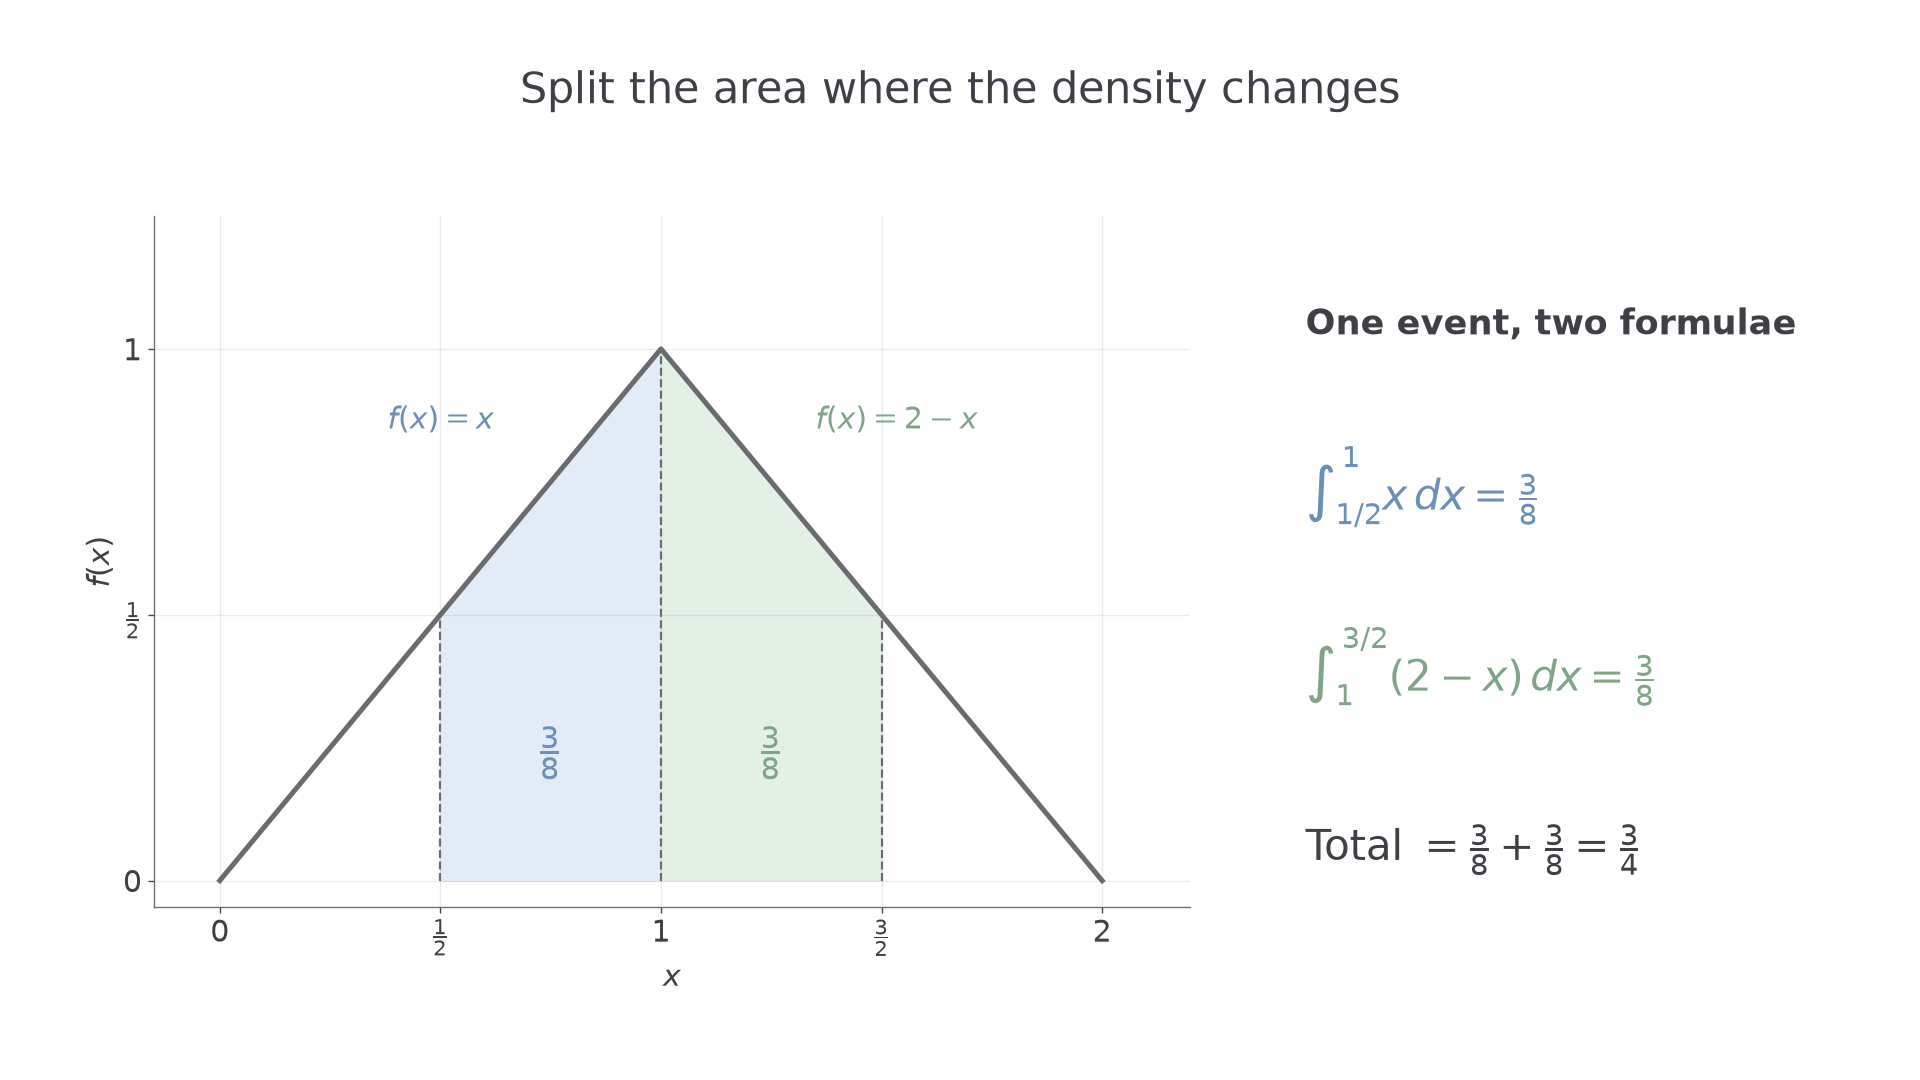
The two-piece density from the preceding example has . Its area from to is ; its area from to is the remaining . An interval crossing needs both expressions.
[DIAGRAM: asset_name: Split a probability at the density join; asset_slug: h245_5_03_piecewise_area; caption: The interval from one half to three halves crosses the join at 1, so its probability is the sum of two shaded integrals; description: Triangular density f(x) equals x on 0 to 1 and 2 minus x on 1 to 2, with zero density elsewhere. Blue shading covers one half to 1 and sage shading covers 1 to three halves. Each shaded area is three eighths and their total is three quarters. The two integrals are written in a separate side panel]
Worked example 3: an interval within one piece
Question. Let for , for , and zero otherwise. Find .
Plan. Both limits lie in the first piece, so integrate between them.
Why this step? The density formula outside this event contributes no area to this probability.
Answer. .
Check. The region is a trapezium with parallel sides and , separated by , so its area is .
Worked example 4 changes only the interval: it now crosses the join. Keeping one expression throughout would give the wrong area.
Continue this lesson.
You’re previewing NovaLearn without an account. Create a free account to read the rest.
Create free account