5.05c - Hypothesis tests for a population mean
Use a normal distribution to decide whether sample data provide significant evidence about a population mean. You will choose the correct tail, distinguish a known population variance from an estimated one, and write a conclusion that says what the evidence supports without claiming certainty.
Hypotheses and the sampling model
A measuring process is meant to have population mean . A sample mean is . Is that evidence of a shift, or an ordinary fluctuation? The gap alone cannot answer: you need the spread of sample means and the direction of the claim.
A hypothesis test temporarily assumes a stated population mean. It asks whether a sample result at least as extreme as yours would be unusual under that assumption. It does not calculate the probability that the assumption is true.
You already know
For a random independent sample, and . A normal population makes exactly normal; a sufficiently large sample from another population with finite variance makes its distribution approximately normal. Estimate an unknown variance using , with denominator .
Write hypotheses about the population parameter, not the observed sample mean. Define the parameter in context before using its symbol.
Null and alternative hypotheses
The null hypothesis specifies the population mean . The alternative is the claim being tested: , , or . An increase or decrease gives a one-tailed test; a difference in either direction gives a two-tailed test.
For example, if is the population mean output of a measuring process, “has increased from ” gives , . “Has changed from ” gives . Choose the alternative from the question before inspecting the sample result.
| Population and sample | Distribution used for the mean under | Reason |
|---|---|---|
| Normal population, known, given or assumed variance ; any sample size | , exactly | Independent normal observations |
| Any population with finite known, given or assumed variance ; large sample | , approximately | Central limit theorem |
| Any population with finite unknown variance; large sample | , approximately | Central limit theorem and estimated variance |
All three cases require random independent observations from the population being tested. A small sample from an unspecified population does not justify a normal test. A normal population with unknown variance and a small sample is also outside these normal-test cases.
p-value and significance level
A p-value is the probability, assuming and the model, of a test result at least as extreme as the observed one in the direction or directions specified by . The significance level is the preselected threshold for rejecting .
For a continuous normal test, reject when the p-value is at most ; otherwise do not reject it. This decision rule is not printed in the formula booklet: learn it. Under a correct exact null model, a test still rejects a true null in of repetitions. A rare result is evidence, not a logical contradiction.
Key idea
Build the sampling distribution around the null mean , then locate the observed sample mean within it. The data provide the observation; they do not replace the null mean at the centre.
The first decision is linguistic as well as mathematical: decide which population claim the question is asking you to examine.
One-tailed tests with known variance
For a known normal population variance, standardise the sample mean using its standard error. Keep the sign: it tells you which side of the null mean the observation occupies.
Standardising under a normal null model
If the population is normal with known, given or assumed variance , then under ,
The observed value is . Random independent sampling is required.
In the formula booklet.
For an upper-tail alternative use ; for a lower-tail alternative use . These tail-selection rules are not printed in the formula booklet: learn them. Equivalently, at the level the upper critical value is and the lower critical value is ; normal percentage points are supplied in the booklet. Do not choose a small tail merely because it gives a significant result.
Worked example 1: evidence of an increase
Question. A measuring process has normally distributed outputs with known variance . A random independent sample of outputs has mean . Test, at the significance level, whether its population mean has increased from .
Plan. Define the population mean, use the null sampling distribution, and compare its upper-tail probability with .
Let be the population mean output. Then , .
Why this step? The population standard deviation is , but the random quantity being tested is an average of outputs, whose standard deviation is .
Answer. Reject . There is sufficient evidence at the level that the population mean output has increased from .
Check. The critical sample mean is . The observed mean lies above it.
Worked example 2 changes only the observed sample mean. The same method now illustrates what a non-significant result allows you to say.
Worked example 2: an increase too small to establish
Question. The same normal process, with known variance , gives a random independent sample of outputs with mean . Test, at the level, whether its population mean has increased from .
Plan. Use the same hypotheses and null standard error, with the new observation.
Let be the population mean output, with , .
Why this step? A sample mean above is not enough by itself. The upper-tail probability measures how surprising this increase is under .
Answer. Do not reject . There is insufficient evidence at the level that the population mean output has increased from .
Check. , so the observed sample mean is outside the upper critical region.
If the claim had instead been a decrease, these positive test statistics would give large lower-tail probabilities. Data in the opposite direction do not support a one-tailed claim.
Watch out
Wrong: “Do not reject , so the population mean is .” A non-significant result does not establish equality. Right: “There is insufficient evidence that the population mean has increased from .” Keep the conclusion in context and at the stated level.
Now change the direction of the claim. The hypotheses are supplied so you can concentrate on the lower tail.
Two-tailed tests and large samples
A claim that a population mean has changed must allow evidence in either direction. At the significance level, each normal tail receives , not .
[DIAGRAM: asset_name: One-tailed and two-tailed critical regions; asset_slug: h245_5_05_critical_tails; caption: A 5 percent upper-tail test uses 1.645 while a 5 percent two-tail test uses minus and plus 1.960; description: Two standard normal density plots. The left plot shades the upper 0.05 tail beyond 1.645. The right plot shades each 0.025 tail beyond minus 1.960 and plus 1.960, with observed z equal to 1.8 marked to show it is significant only for the upper-tail alternative.]
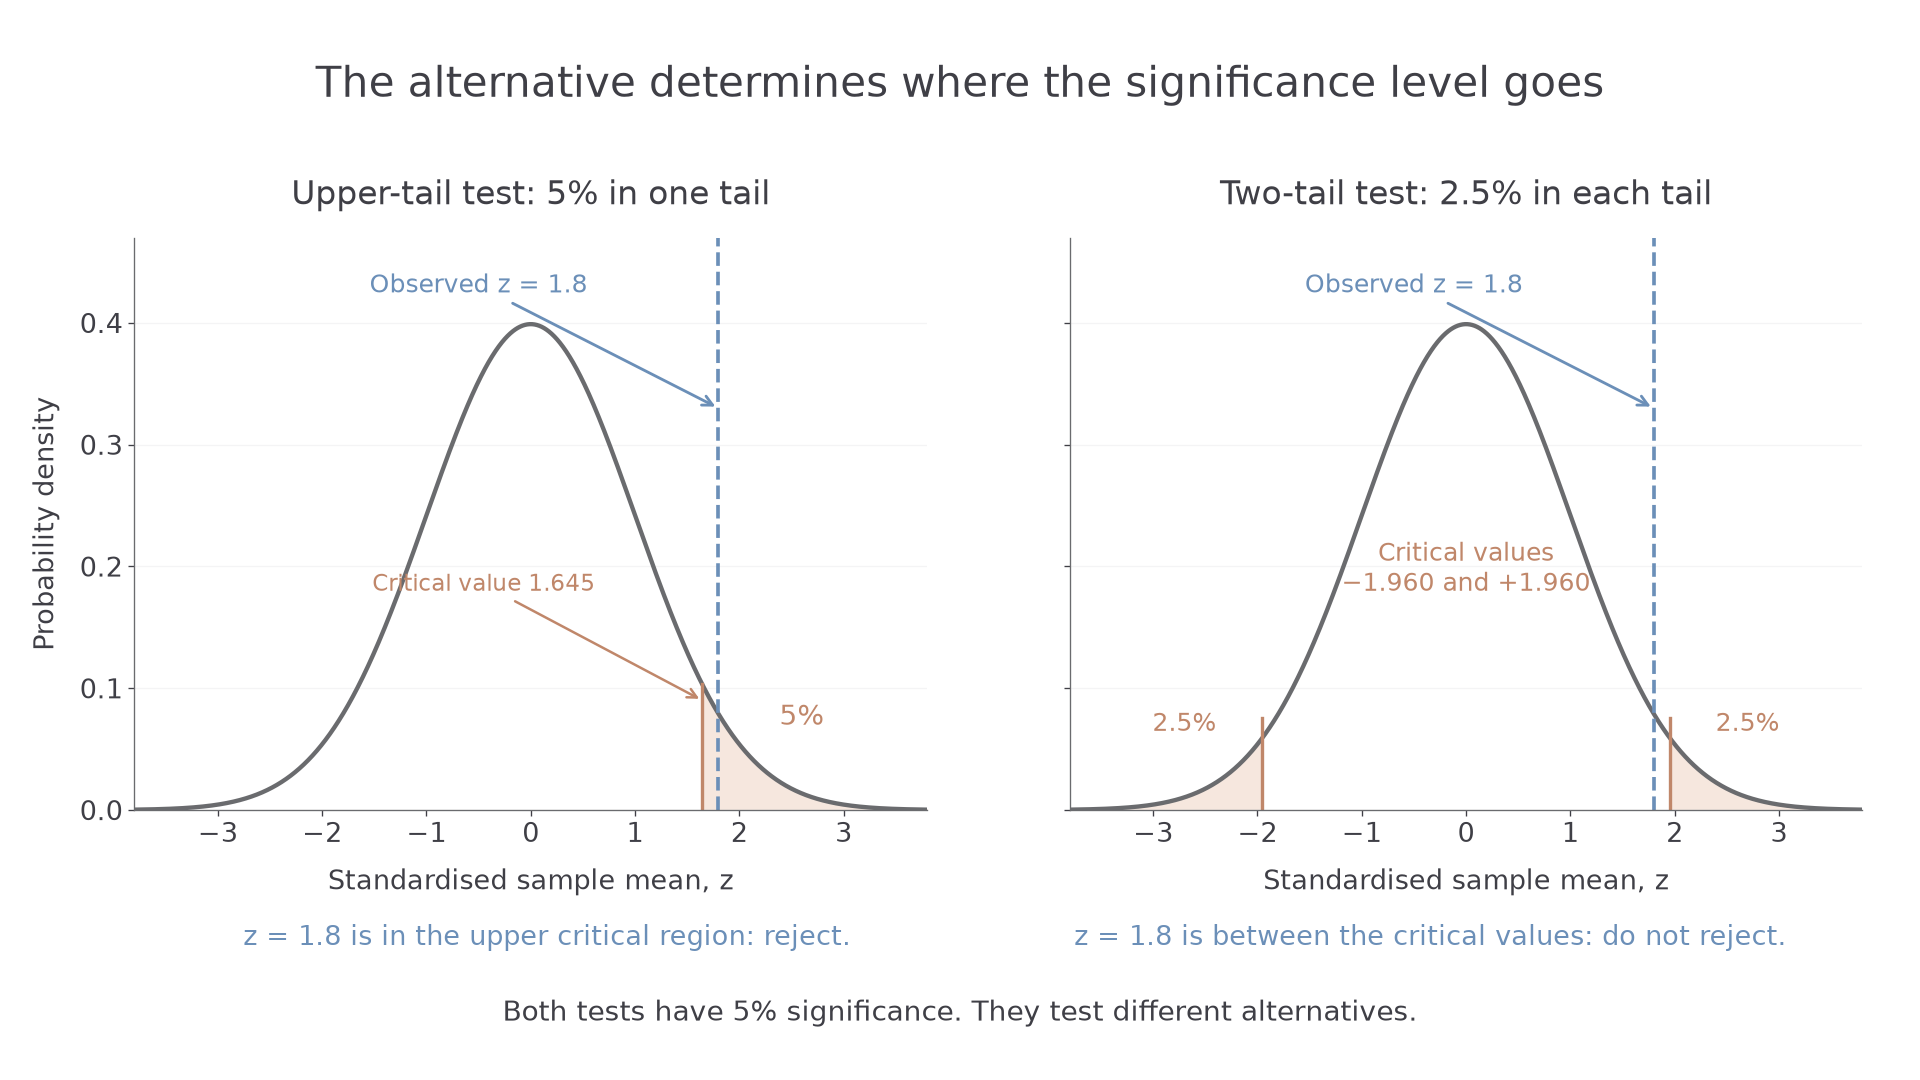
For a large independent sample from an unspecified population, use the central limit theorem for the shape of . Its mean and variance still come from the exact sampling-moment formulae. If the population variance is known, do not introduce an estimated-variance correction.
A two-tailed normal mean test
For a normal or approximately normal sample mean under , with known variance , calculate
Reject at level if . Equivalently, reject if , where . The standardisation and normal percentage points are supplied, but this two-tailed decision rule is not printed.
Not in the formula booklet: learn it.
Continue this lesson.
You’re previewing NovaLearn without an account. Create a free account to read the rest.
Create free account