5.07f - Normal approximations for Wilcoxon tests
Large rank sums can be tested using a normal approximation rather than a small-sample table. In 5.07f you will choose the correct signed-rank or rank-sum distribution, apply a continuity correction, and make one-sided or two-sided decisions without confusing a raw rank sum with a folded statistic.
Which rank sum is approximately normal?
With signed ranks, the positive ranks sum to . Is that unusually large, or simply a large number because there are many ranks? The total available is ; under the null, the expected positive share is half, . You need its spread before judging the evidence.
You already know
Write a normal distribution as , with variance second. A signed-rank test uses absolute differences and their signs; a rank-sum test uses one independent sample's positions in a pooled ranking. Small-sample tables use the smaller of two reflected sums.
For signed ranks, under a continuous symmetric null population, each rank is equally likely to receive a positive or negative sign. The positive sum is therefore a sum of independent contributions: rank contributes either or , each with probability . Many contributions produce a roughly bell-shaped distribution. The normal approximation concerns or separately.
The minimum cannot exceed half the total. Its distribution is folded and is not the normal distribution printed in the booklet. Similarly, for independent samples the normal approximation applies to the raw rank sum , not to the folded small-sample-table statistic .
Raw and folded rank sums
A raw rank sum retains which sign group or sample it belongs to: , or . A folded statistic takes the smaller of a sum and its reflection. The booklet's large-sample normal approximations describe the raw sums; the table headings and must not obscure that distinction.
The large-sample approximation keeps the original sampling assumptions. Signed-rank observations, or paired differences, must be independent and continuous with a symmetric population distribution. For rank-sum tests, the two random samples must be independent, with identical continuous population distributions under the null. There are no zero signed differences or tied ranks in the calculations here.
Use the signed-rank approximation for sufficiently large ; the supplied exact table runs to . For the rank-sum approximation both sample sizes must be sufficiently large. One large group does not by itself justify approximating a tiny group's rank-sum distribution. There is no single universal sample-size cut-off that replaces checking the model and the question's stated conditions.
Key idea
Normal approximations use the distribution of a specified raw rank sum under the null, with the same design assumptions as the exact test and a continuity correction for integer ranks.
The error below occurs before any standardisation. A correct variance cannot repair the wrong random variable.
A normal approximation for signed ranks
Use the observed positive rank sum and choose its tail from the median alternative. An integer sum includes a whole unit-wide interval in the continuous approximation.
Under the null, rank 's mean contribution is and its variance is . Adding these contributions explains the supplied mean and variance: half the rank total is the mean, and a quarter of the sum of squared ranks is the variance.
Signed-rank normal approximation
For sufficiently large , with independent non-zero differences from a continuous symmetric population and no tied absolute differences, under the zero-centre null,
The same approximation applies to separately. For a one-sample test, differences are taken from the hypothetical median; for paired data, they are the defined within-pair differences.
In the formula booklet.
The continuity correction follows the event. For an integer statistic , the event becomes ; becomes , where is the continuous approximation. Strict inequalities first become their equivalent inclusive integer events: means , hence boundary . This event rule is not printed in the booklet: learn it.
[DIAGRAM: asset_name: A rank sum includes its whole unit interval; asset_slug: h245_5_07_continuity_correction; caption: An upper-tail event from 330 starts at 329.5 in the normal approximation; description: A normal curve with mean 232.5 and standard deviation about 48.62 has the area to the right of 329.5 shaded blue. An enlarged integer strip below shows blocks for rank sums 328 through 332, with the block centred at 330 spanning 329.5 to 330.5 and a vertical dashed boundary at 329.5.]
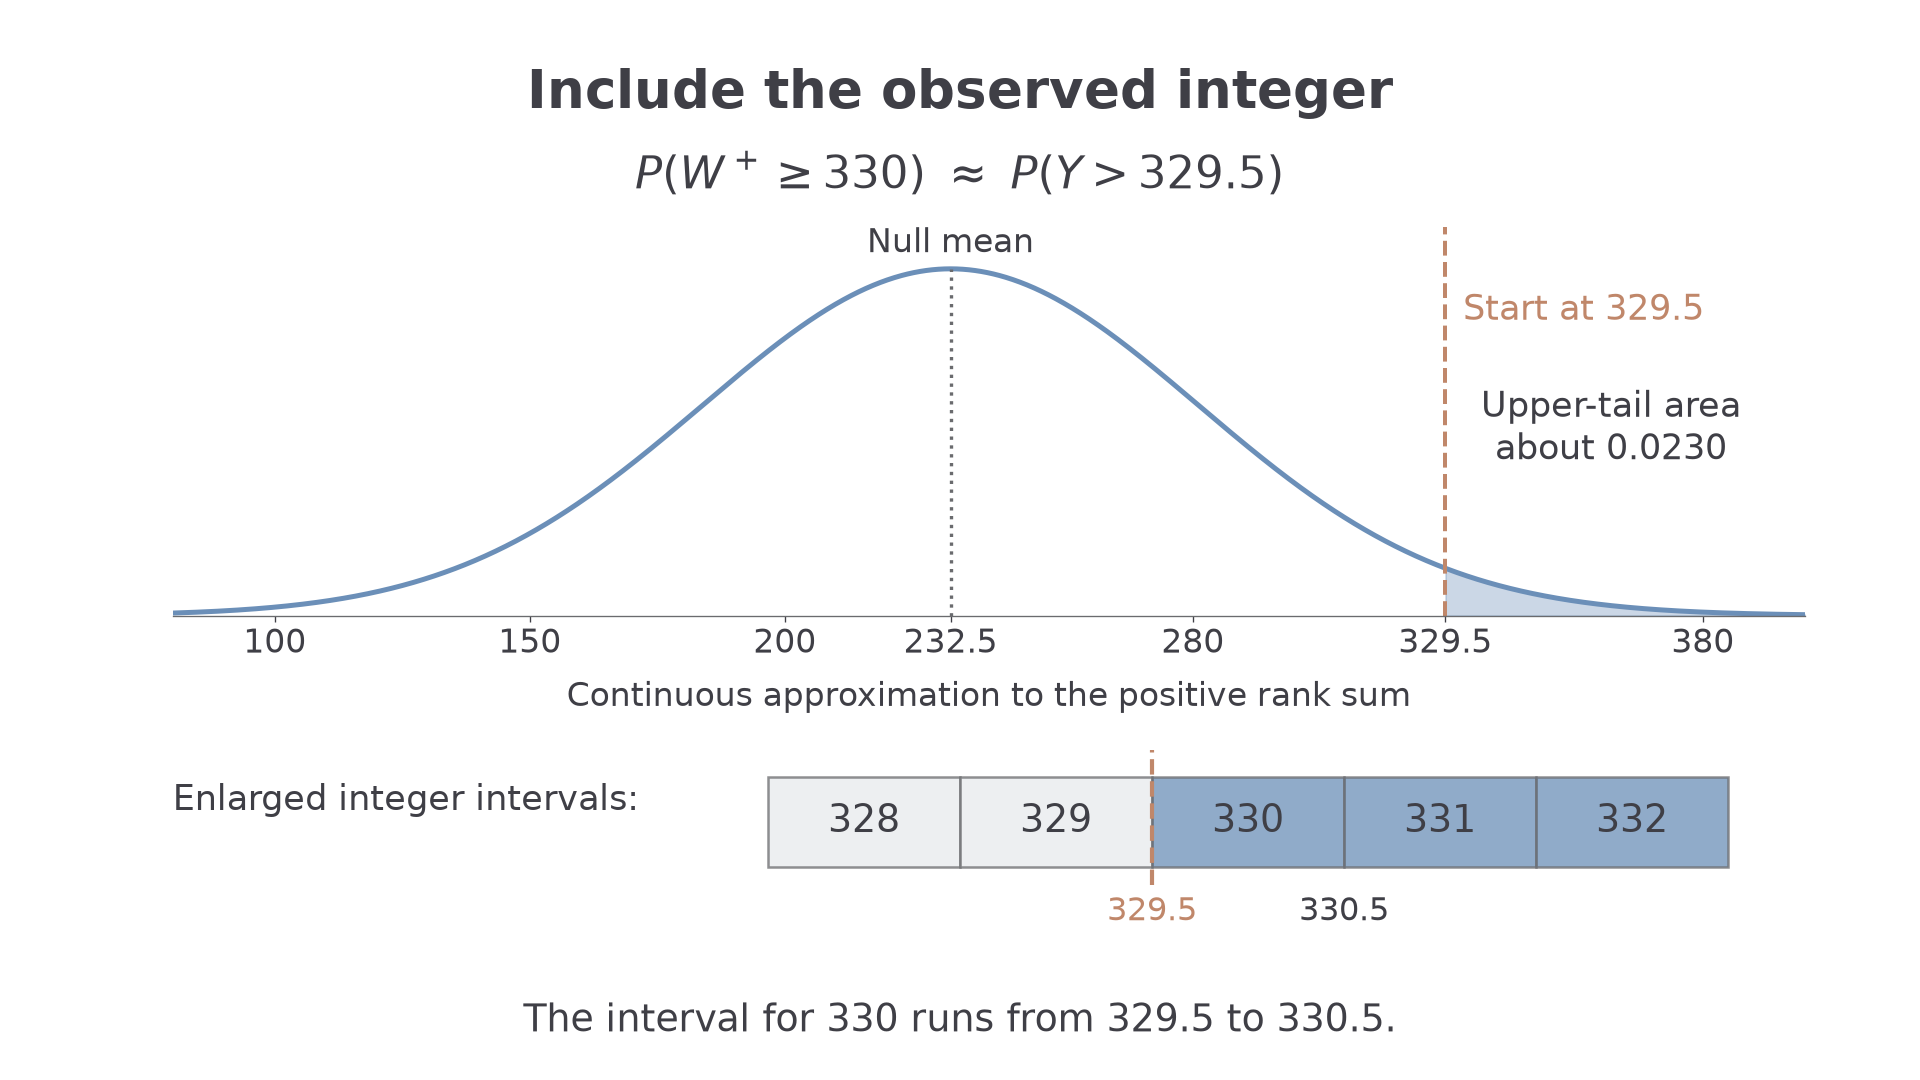
The boundary lies half a unit before the first included integer. It is chosen from the event, not from whether the observed sum happens to lie above or below its mean.
Worked example 1: a large positive rank sum
Question. A random independent sample of observations comes from a continuous symmetric population with median . Signed ranks relative to give . Use a normal approximation to test against at . There are no zero differences or tied absolute differences.
Plan. Model under the null and calculate its continuity-corrected upper-tail probability.
Why this step? The event includes the observed integer . Its normal area begins at , not .
Answer. Since , reject . There is significant evidence that the population median exceeds .
Check. ; the positive sum is the larger one, consistent with the direction of the alternative.
Worked example 2 reflects the evidence: the alternative is now a smaller median and the positive rank sum is . The corrected lower tail should give the same probability.
Worked example 2: the corresponding lower tail
Question. Under the same sampling assumptions, a second sample of observations gives . Test against at .
Plan. Use the same null mean and variance, but include the observed integer in a lower-tail event.
Why this step? A lower-tail event through ends at . Adding half a unit here includes the observed outcome rather than making an arbitrary adjustment towards the mean.
Answer. There is significant evidence that the population median is less than .
Check. , so the two examples have equal normal-tail probabilities.
Both examples answer the opening question: is roughly two null standard deviations above the expected positive sum, with one-sided approximate probability .
Watch out
Wrong: divide by when standardising. Right: divide by , because the second parameter of is a variance, not a standard deviation.
Use the same event-first reasoning with a different sample size and supplied hypotheses.
A normal approximation for independent rank sums
For two independent groups, approximate the raw sum of the smaller sample's pooled ranks. There is no subtraction of paired measurements and no signed-rank sample size.
Let the sample sizes be . Under identical continuous population distributions, each of the observations has expected pooled rank . Multiplying by gives the null rank-sum mean. The ranks are sampled without replacement, so the supplied variance accounts for their dependence; treating the ranks as independent uniform draws would give a different variance.
Continue this lesson.
You’re previewing NovaLearn without an account. Create a free account to read the rest.
Create free account