4.08e - Mean value of a function
Find the average height of a curve over an interval, and use it to interpret a changing quantity. You will distinguish a function's mean value from the average of its endpoint values, evaluate exact means by integration, and work backwards from a given mean.
A constant height with the same integral
If a quantity follows from to , what single height should represent its average: , , or something else?
The endpoint values are and , but averaging those two numbers ignores every value between them. A curve can spend much of an interval below that endpoint average. Instead, replace the curve by a horizontal line with the same signed area over the whole interval.
You already know
A definite integral gives signed area: regions above the horizontal axis contribute positively and regions below contribute negatively. You can evaluate it using an antiderivative and the limits.
A constant function with height has integral . To give it the same integral as , require , then divide by the interval's width.
Mean value of a function
The mean value of an integrable function on , where , is the constant height having the same integral over that interval as . It averages the function over the independent variable, with equal weight for equal widths.
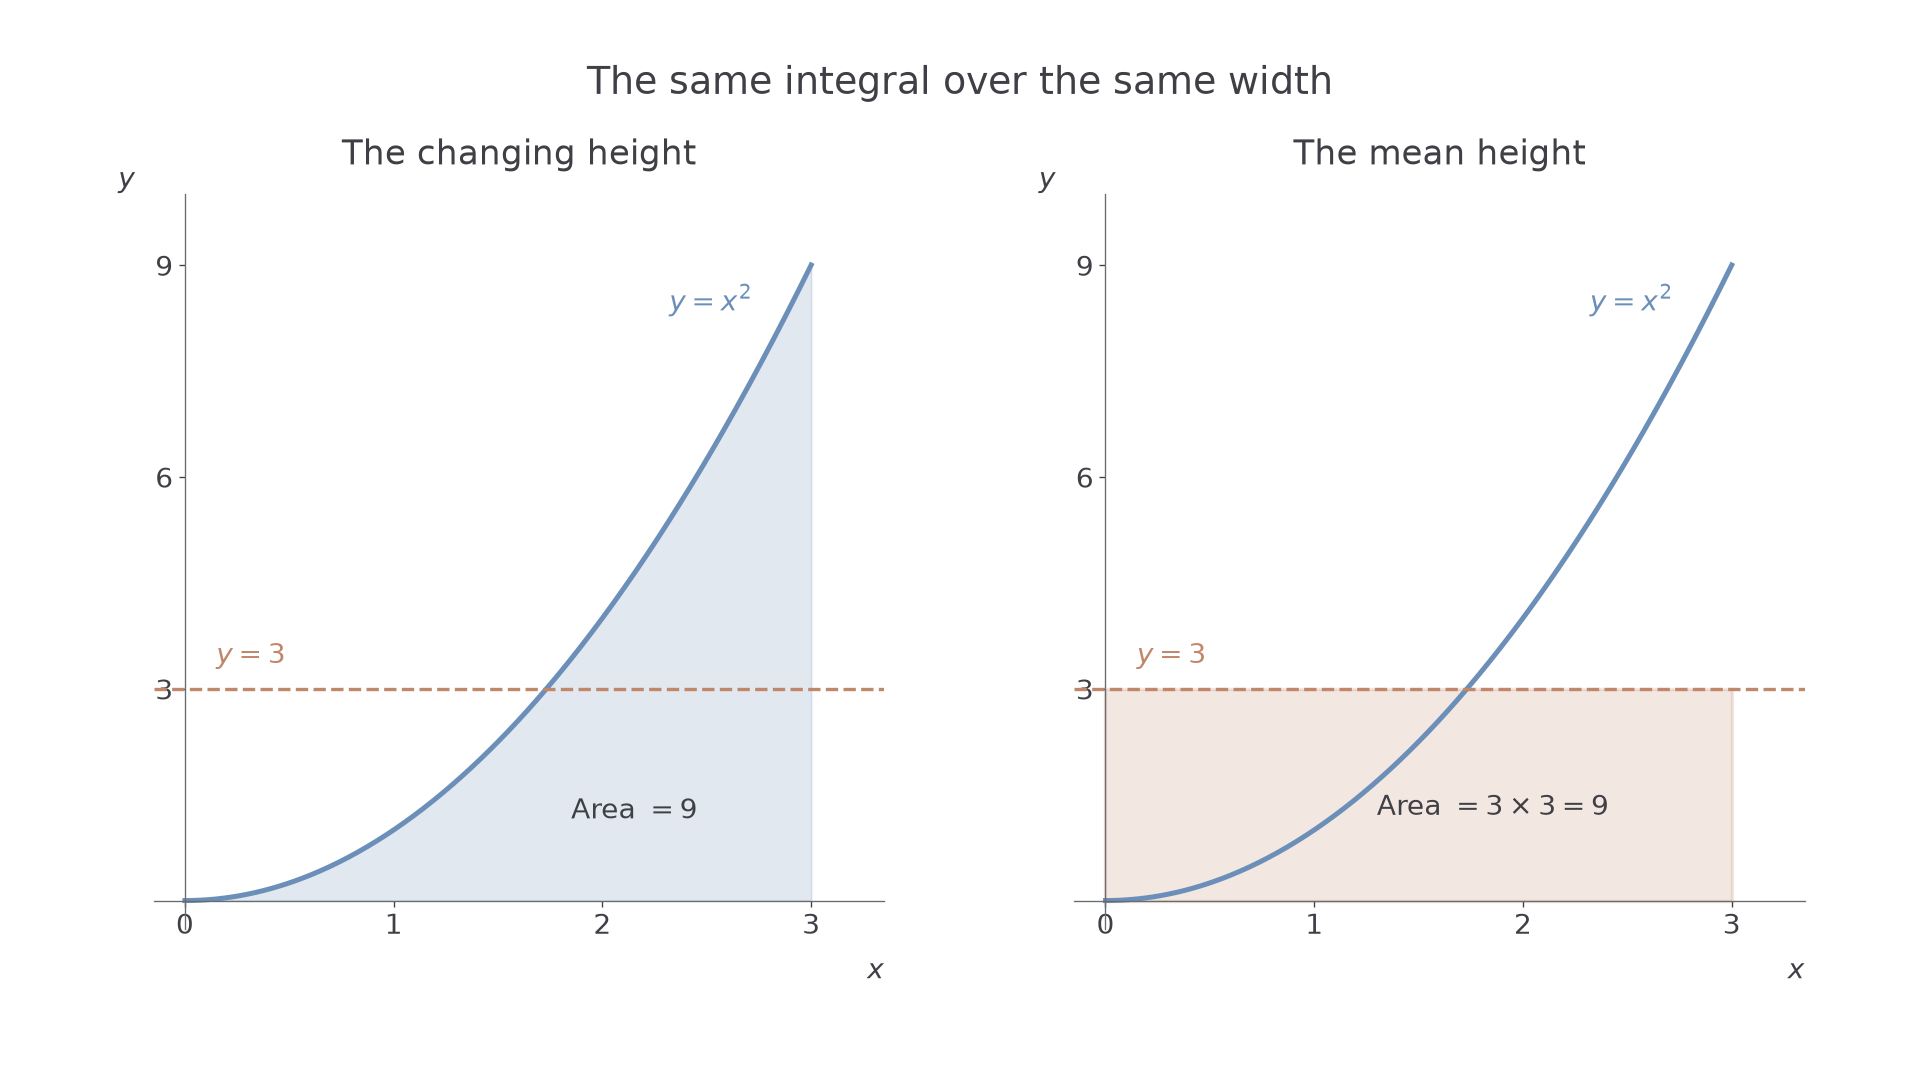
For the opening curve, the integral is . The rectangle must therefore have height , even though the average of the two endpoint heights is .
[DIAGRAM: asset_name: A mean height replaces a curve; asset_slug: h245_mean_equal_area; caption: On the interval from 0 to 3, the curve y = x squared and the rectangle of height 3 both have area 9; description: Two side-by-side coordinate plots of y equals x squared on zero to three, with the curved region shaded blue on the left and a rectangle of width three and height three shaded clay on the right. Both plots show the horizontal line y equals three, and each shaded area is labelled nine.]
The same definition works when the graph crosses the axis. For on , the two triangular regions cancel, so the mean is . Averaging would give : that is the mean magnitude, a different question. A function can have mean zero while being non-zero almost everywhere.
Mean value on an interval
For an integrable real-valued function on a finite interval , with ,
The divisor is the width of the interval, and the integral is signed.
In the formula booklet.
This is the continuous counterpart of adding many equally spaced heights and dividing by their number. If strips have width , then their average height is ; the sum of the strip areas approaches the integral.
Key idea
A mean value preserves the integral over the interval, so it uses all the heights rather than only the two endpoints.
Test that distinction on a deliberately flawed calculation.
Evaluating a mean value
Write the averaging factor before integrating, so that the final answer is a height rather than an area.
The definite integral has units of function value multiplied by independent variable. Dividing by cancels the independent variable's units. For example, integrating power in kilowatts over hours gives energy in kilowatt-hours; dividing by the number of hours gives mean power in kilowatts.
Worked example 1: the opening curve
Question. Determine the exact mean value of on .
Plan. Divide the definite integral of by the interval's width, .
Why this step? The integral is , but the average height is the area shared over a width of .
Answer. The exact mean value is .
Check. A rectangle of height and width has area , equal to the curve's integral. Also , so the mean lies between the minimum and maximum values.
The second example changes only the lower endpoint. Removing the lowest part of an increasing curve should raise its mean, and the averaging factor must change too.
Continue this lesson.
You’re previewing NovaLearn without an account. Create a free account to read the rest.
Create free account