Paper 5 - Error bars and worst acceptable lines
Learn to carry uncertainty estimates into derived tables and graphs. Draw and distinguish a balanced best-fit line and an extreme acceptable line, then obtain gradient and intercept uncertainties without losing signs, units or the true origin.
Carrying uncertainty into the plotted quantities
Can a line pass through both end error bars and still be unacceptable? An intermediate measurement may rule it out. First we need every plotted point and its uncertainty, including the uncertainties of quantities calculated from raw readings.
Follow the Paper 3 table conventions: clear quantity/unit column headings, raw readings matching instrument resolution, and calculated values generally to the same number of significant figures as the least precise source value or one extra. Keep guard digits internally. Record each absolute uncertainty beside the corresponding value, not an unexplained percentage at the top of the page. An uncertainty estimate includes the measurement conditions as well as the instrument's scale.
For a derived power , the small-uncertainty estimate is . The absolute exponent matters even for a negative power. This is the conservative propagation method recalled from the uncertainty lessons, not a supplied Paper 5 formula. For the particular derived quantity , with in millimetres, and its absolute uncertainty have unit .
For the first row, and . The table rounds the uncertainty and the value to compatible decimal places.
Logarithms need a transformed interval, not a copied voltage or length uncertainty. If , calculate and . These limits may be slightly asymmetric. For small relative uncertainty, a symmetric estimate is adequate when the task requests it; use a stated rounded estimate that covers the interval. For , , with limits and . A suitable rounded result is , dimensionless. If the lower limit is zero or negative, a real logarithmic interval cannot be formed: reconsider the measurement range or model.
[DIAGRAM: asset_name: What horizontal and vertical error bars mean; asset_slug: practical-a2-error-bars; caption: Each error bar extends one absolute uncertainty from its central value in both directions; description: A voltage-time point at time 4.0 seconds and voltage 5.0 volts has horizontal uncertainty plus or minus 0.4 seconds and vertical uncertainty plus or minus 0.3 volts. The graph labels all four limits and shows that the full bar lengths are 0.8 seconds and 0.6 volts, not the half-length uncertainty values.]
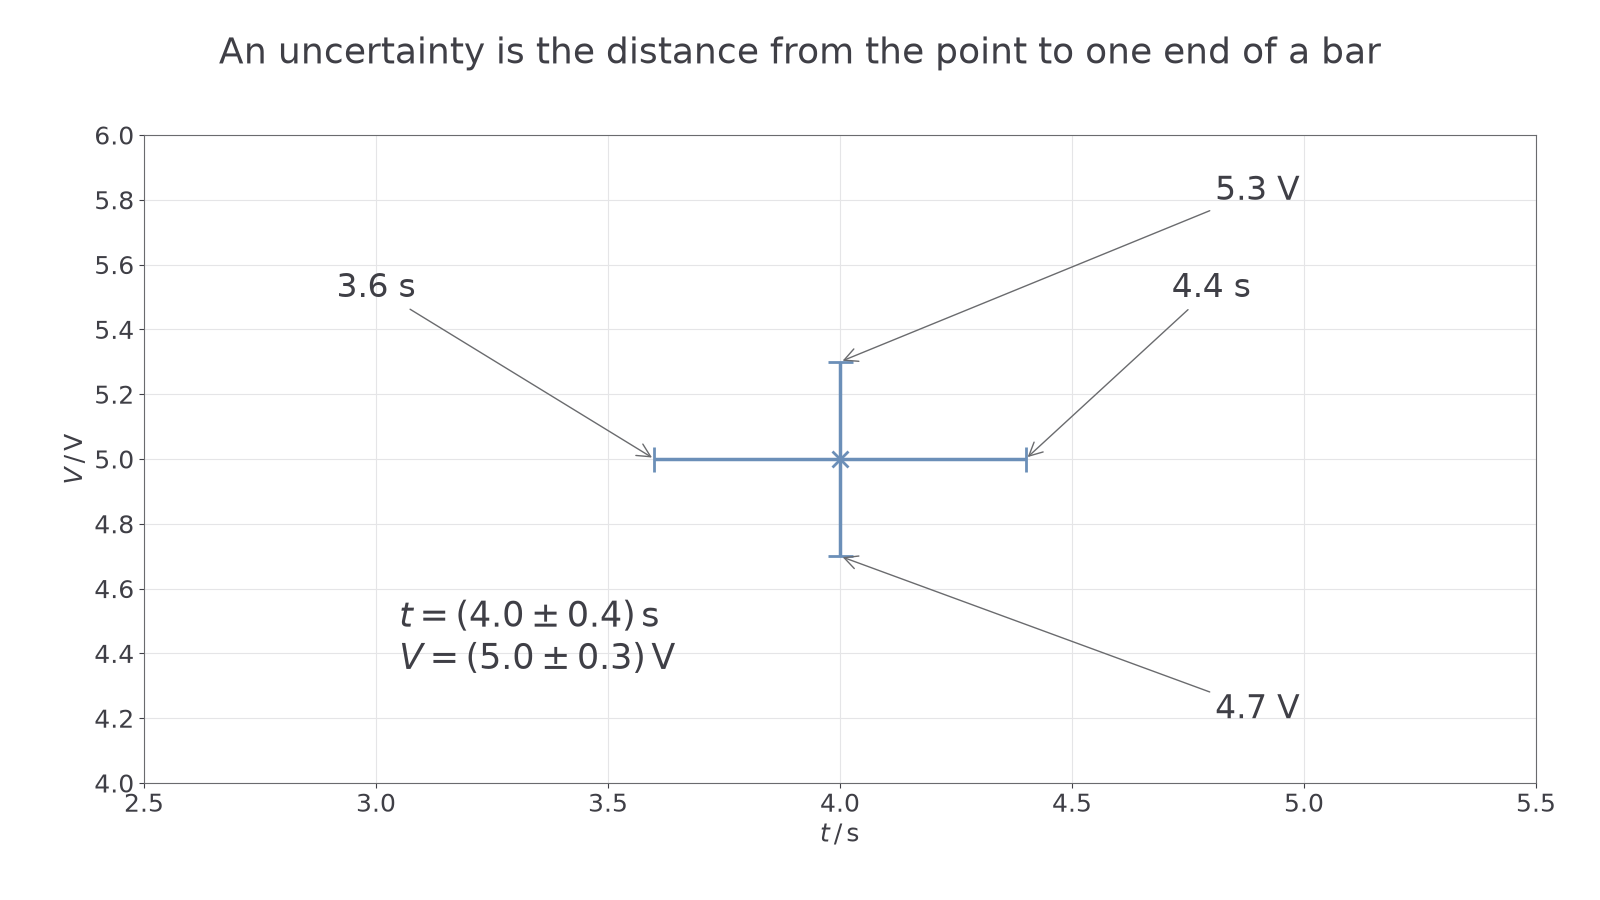
Plot fine crosses and clear error-bar caps. A quoted means a bar from to : the full length represents . Show horizontal and vertical bars where both coordinates have relevant uncertainties. If horizontal uncertainty is negligible or the task only supplies a vertical uncertainty, do not invent an extra bar. Use the actual interval when a transformation makes it significantly asymmetric.
Watch out
An error bar represents uncertainty in that plotted quantity. A percentage uncertainty is not the bar length, and a voltage uncertainty cannot be attached unchanged to a dimensionless logarithm.
A line must satisfy all the uncertainty intervals
A best-fit line represents the central trend, balancing the deviations along the whole set of points. It is not necessarily a line through two measured points. A worst acceptable line asks a different question: how far could the gradient change while remaining consistent with every uncertainty interval?
The following supplied teaching data describe a capacitor discharged by an approximately constant-current device, for which voltage is expected to fall linearly with time. This is not the exponential discharge through a fixed resistor. Time uncertainty is negligible here; the voltage estimates include read-off and fluctuation effects.
[DIAGRAM: asset_name: Endpoints do not determine every acceptable line; asset_slug: practical-a2-worst-lines; caption: The third error bar rejects the line drawn through the two outer endpoint extremes; description: Two graphs show all six supplied voltage-time points and their vertical error bars. The first shows the line through the upper first limit and lower last limit missing the third error bar. The second shows a balanced best fit V equals 9.10 minus 0.100t, a valid shallow extreme V equals 8.73 minus 0.0880t, and a valid steep extreme V equals 9.35 minus 0.10833t. All three valid lines intersect all six bars, and the two extreme gradients are visibly labelled.]
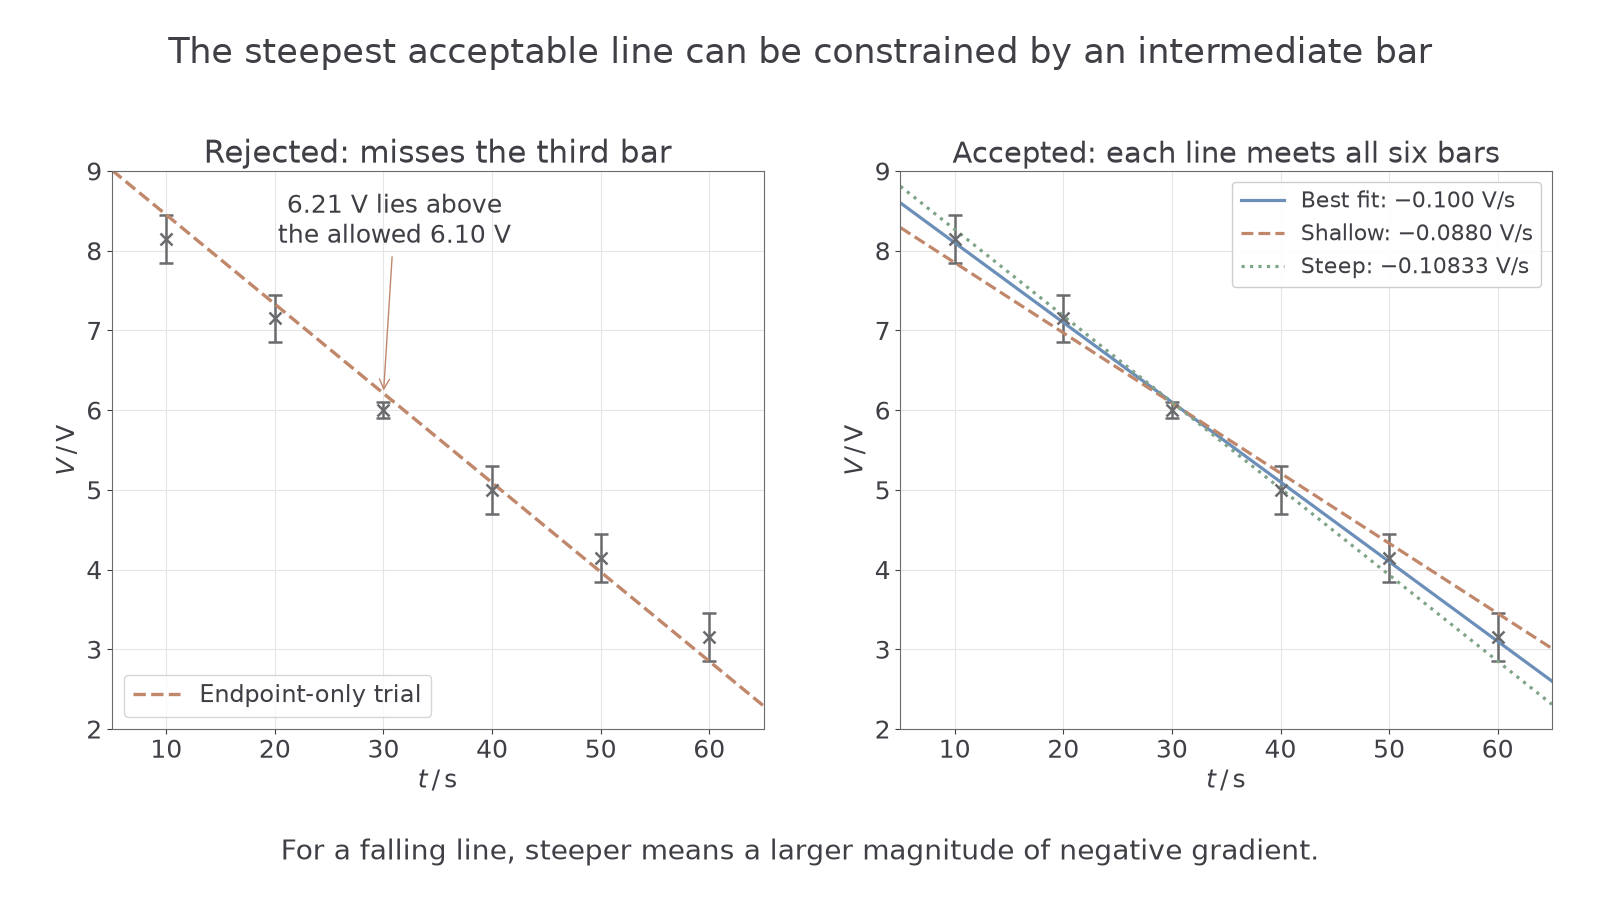
An endpoint-only attempt joins to . Its gradient is , with intercept . At , it predicts , outside the third interval –. It is therefore unacceptable even though it meets both end bars.
Continue this lesson.
You’re previewing NovaLearn without an account. Create a free account to read the rest.
Create free account