1.3 - Errors, precision and accuracy
Distinguish systematic and random errors, correct a zero error, and judge accuracy separately from precision. Learn why a beautifully repeatable result can still be wrong, and choose an improvement that addresses the actual error.
Systematic errors and zero corrections
If a balance reads with nothing on its pan, will weighing an object ten times fix the result? All ten readings may agree impressively. They can also all be too high.
An error is a difference between a measured value and the true value. Usually the true value is unknown, so you cannot calculate the actual error directly. You can nevertheless identify a mechanism that biases the measurements and test for it.
Systematic error
A systematic error affects measurements in a consistent way, shifting them in one direction or changing them according to a consistent pattern. A zero error is one example.
For the balance, the unwanted offset is added to every reading. Repeating the same procedure preserves the offset. You should check and reset the zero, or subtract the measured offset from subsequent readings. This is correction, rather than averaging away the problem.
A zero error can be positive or negative. An instrument that reads below zero when it should read zero has a negative zero error. Subtracting a negative error increases the corrected value.
Worked example 1: correcting a positive zero error
Question. A balance reads with an empty pan and with a sample. Find the corrected sample mass.
Plan. Subtract the empty-pan reading from the loaded reading.
Answer. .
Check. The balance over-read, so the corrected value must be lower. Applying this correction does not remove every other source of uncertainty.
A second example catches the sign that often causes trouble.
Worked example 2: correcting a negative zero error
Question. A micrometer reads when its measuring faces are correctly closed. A wire gives a reading of . Determine its corrected diameter.
Plan. Subtract the zero reading, including its sign.
Answer. .
Check. This instrument under-read, so its correction must increase the value.
Not every systematic error is a zero error. A stretched measuring tape can make its readings wrong by a proportion, and a thermometer calibrated against an incorrect reference can have a scale error. Resetting zero will not repair every scale error; comparison with known standards is needed. Reading a scale from the same wrong viewing angle may also cause a consistent parallax bias.
Watch out
“Systematic” does not mean “the same numerical error in every experiment”. A constant zero offset is one case. A scale error can grow with the reading. Identify the mechanism before choosing a correction.
Try applying the sign convention rather than a memorised “always add” rule.
Random errors and repeated readings
Repeated readings often differ even when the quantity being measured is unchanged. The differences may come from changing reaction times, fluctuations in an electrical signal, or uncertainty in judging a moving pointer's position.
Random error
A random error varies unpredictably between readings and causes scatter in repeated measurements. Its effect can make an individual reading either too high or too low.
Suppose you time the same short event repeatedly. Sometimes you start the stop-watch a little late; sometimes you stop it a little late. The net effect varies. Record the readings rather than choosing whichever one looks most convincing. A mean gives an estimate of the common value, with positive and negative deviations tending to cancel partly.
Practical: timing a repeated event
Five time measurements are , , , and .
Plan. Add the five values and divide by five.
Answer. The mean is . The readings span , so reporting the result to many more decimal places would suggest more certainty than the measurements support.
Check. The mean lies between the lowest and highest readings. It is an estimate, not a guaranteed true value.
Repeated measurements make scatter visible and usually reduce the effect of random error on the mean. They do not guarantee that the mean is correct. If the stop-watch consistently runs fast, or the procedure consistently starts timing after the intended starting event, a systematic contribution remains.
For an oscillation, timing many cycles in one interval is often more helpful than timing one cycle repeatedly. The start/stop uncertainty is then shared over a longer total interval. For example, a timing uncertainty of about is a much smaller fraction of than of . You will calculate such fractions in the next lesson.
A good improvement attacks the source. Use a clear viewing reference to judge an oscillating body's passage, a light gate instead of a human reaction time where suitable, or a longer measured interval. “Repeat more” is useful for random scatter, but does not explain what caused the scatter or whether it dominates the experiment.
Key idea
Random and systematic contributions can occur together. A set of readings may scatter around a biased centre. Averaging can reduce the scatter's effect while leaving that centre displaced.
Decide what the evidence supports.
Accuracy and precision
Agreement between readings and agreement with the true value are different tests. Keep them separate whenever you evaluate a measurement.
Accuracy and precision
An accurate measurement is close to the true value. Precise repeated measurements are close to one another, with little scatter.
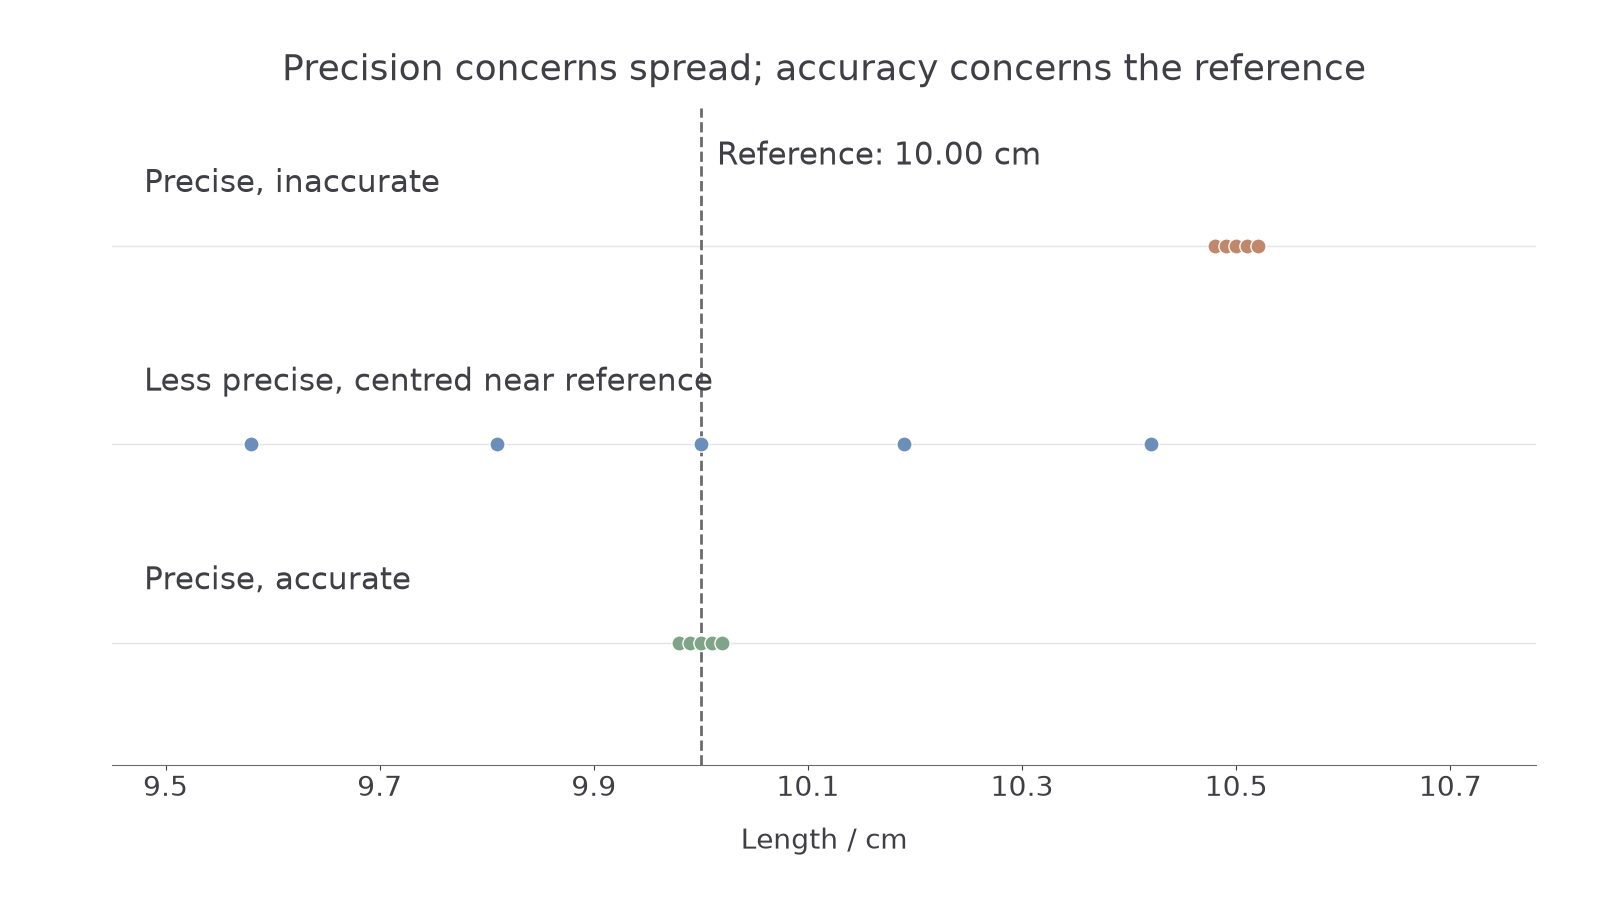
Imagine measuring a reference length whose known value is . A set centred near , with readings only a few hundredths of a centimetre apart, is precise but inaccurate. The small spread cannot rescue the offset. A more scattered set centred near is less precise; its mean may nevertheless be close to the reference.
[DIAGRAM: asset_name: Precision and accuracy separated; asset_slug: precision-accuracy-readings; caption: A tight cluster can miss the reference value, while a wider cluster can be centred on it; description: Three horizontal dot plots of repeated length readings share a 9.5 to 10.7 centimetre axis. A dashed vertical line marks a reference value of 10.00 centimetres. The first tight cluster is centred at 10.50 centimetres and labelled precise but inaccurate. The second wider cluster is centred at 10.00 centimetres and labelled less precise. The third tight cluster is centred at 10.00 centimetres and labelled precise and accurate.]
Resolution is the smallest change an instrument can distinguish or display. A display with more decimal places has finer resolution, but a display can show many repeatable digits around the wrong value. Finer resolution may help precision when the old resolution limited the reading; it does not itself guarantee accuracy.
For a reported result, uncertainty expresses a reasonable range of values consistent with the measurement. It is not the known error. The true value might lie above or below the reported value. A known zero offset should be corrected, rather than merely treated as permission to leave the result biased.
Watch out
“Accurate because the readings agree” is the wrong conclusion. Agreement is evidence of precision. Accuracy requires a valid method and calibration, and can be assessed directly only when a reliable reference is available.
The distinction changes your practical decisions. If readings vary widely, reduce the source of variation or average suitable repeats. If readings consistently disagree with a trusted reference, check calibration, zero and method. If both occur, address both. You will use this diagnosis when deciding which uncertainty is most significant and which improvement would help.
Quick Recap
- Systematic errors affect readings consistently; correct a zero error by subtracting its signed zero reading.
- Random errors cause scatter; suitable repeats and a mean reduce their influence without guaranteeing the true value.
- Accuracy concerns agreement with the true value; precision concerns agreement among repeated readings.
- Instrument resolution, measurement uncertainty and actual error describe different things.
Ten repeated weighings cannot remove the balance's zero offset: check and correct the zero instead.