24.2 - X-ray contrast and computed tomography
Explain how different transmitted X-ray intensities produce image contrast. Distinguish a projection from a reconstructed section, and describe how multiple angular views and successive sections build a three-dimensional CT image.
Different transmission makes structures visible
Can a perfectly sharp X-ray image still hide a structure? Yes: if neighbouring regions give almost the same detector signal, their boundary has little contrast, however sharp the imaging system is.
An X-ray detector records radiation transmitted through the object. A path through bone often attenuates more strongly than an equal-length path through soft tissue, so fewer photons reach that part of the detector. The different signals produce different shades in the image.
Contrast in an X-ray image
Contrast is the difference in degree of blackening or image brightness between the regions being compared.
On conventional film, more transmitted radiation gives greater blackening, so strongly attenuating bone appears relatively pale. A digital display can invert its brightness scale. The physics is the difference in transmitted intensity, not a universal rule that every bright region has one material identity.
Recall . Transmission depends on both the attenuation coefficient and the path length. Material composition and photon energy affect ; density alone is not a complete explanation. A thick, less strongly attenuating region can produce the same signal as a thinner, more strongly attenuating one.
Worked example 1: replacing part of a ray path
Question. One ray crosses of a material with . A second ray has the same total path length, but is replaced by a material with . Compare their transmitted fractions. Treat the coefficients as constant.
Plan. Add each layer's in the negative exponent.
Answer. About 30 per cent and 15 per cent reach the detector respectively. The second signal is about half the first, providing a transmission difference from which contrast can be formed.
Check. Both paths have the same overall thickness. The difference here is the replacement material, not an accidental increase in total distance.
Increasing the source intensity while leaving the spectrum and object unchanged multiplies both transmitted intensities. It does not change their ratio. It may improve counting statistics, but it does not create a missing attenuation difference. Contrast and random image noise are distinct ideas.
Watch out
Resolution describes whether close structures can be distinguished. Contrast describes the difference between their image signals. A clear explanation names the transmitted intensities before discussing the resulting shades.
Some structures have similar attenuation and therefore weak natural contrast. A suitable contrast material can change attenuation in the region being studied, making its detector signal differ more from its surroundings.
Many angular projections reconstruct one section
A conventional radiograph superposes attenuation from everything along each ray. It does not directly reveal where along that path a strongly attenuating region lies. Computed tomography tackles that missing depth information using many directions.
Consider the same two possible arrangements viewed from the left. In the simple diagram, numbers represent dimensionless attenuation contributions along equal cells. Each row has the same total in either arrangement, so one left-to-right projection cannot distinguish them. Looking from another direction gives different totals.
[DIAGRAM: asset_name: Why one projection is ambiguous; asset_slug: projection-ambiguity; caption: Different internal arrangements can give the same projection from one direction; description: Two two-by-two grids contain attenuation contributions 1 and 3 in the first row and 2 and 4 in the second, with the second grid mirrored left to right. Both have row totals 4 and 6. Their column totals differ, being 3 and 7 versus 7 and 3. Equal-size cells and directional arrows show that the numerical totals are projections rather than photographs of a section.]
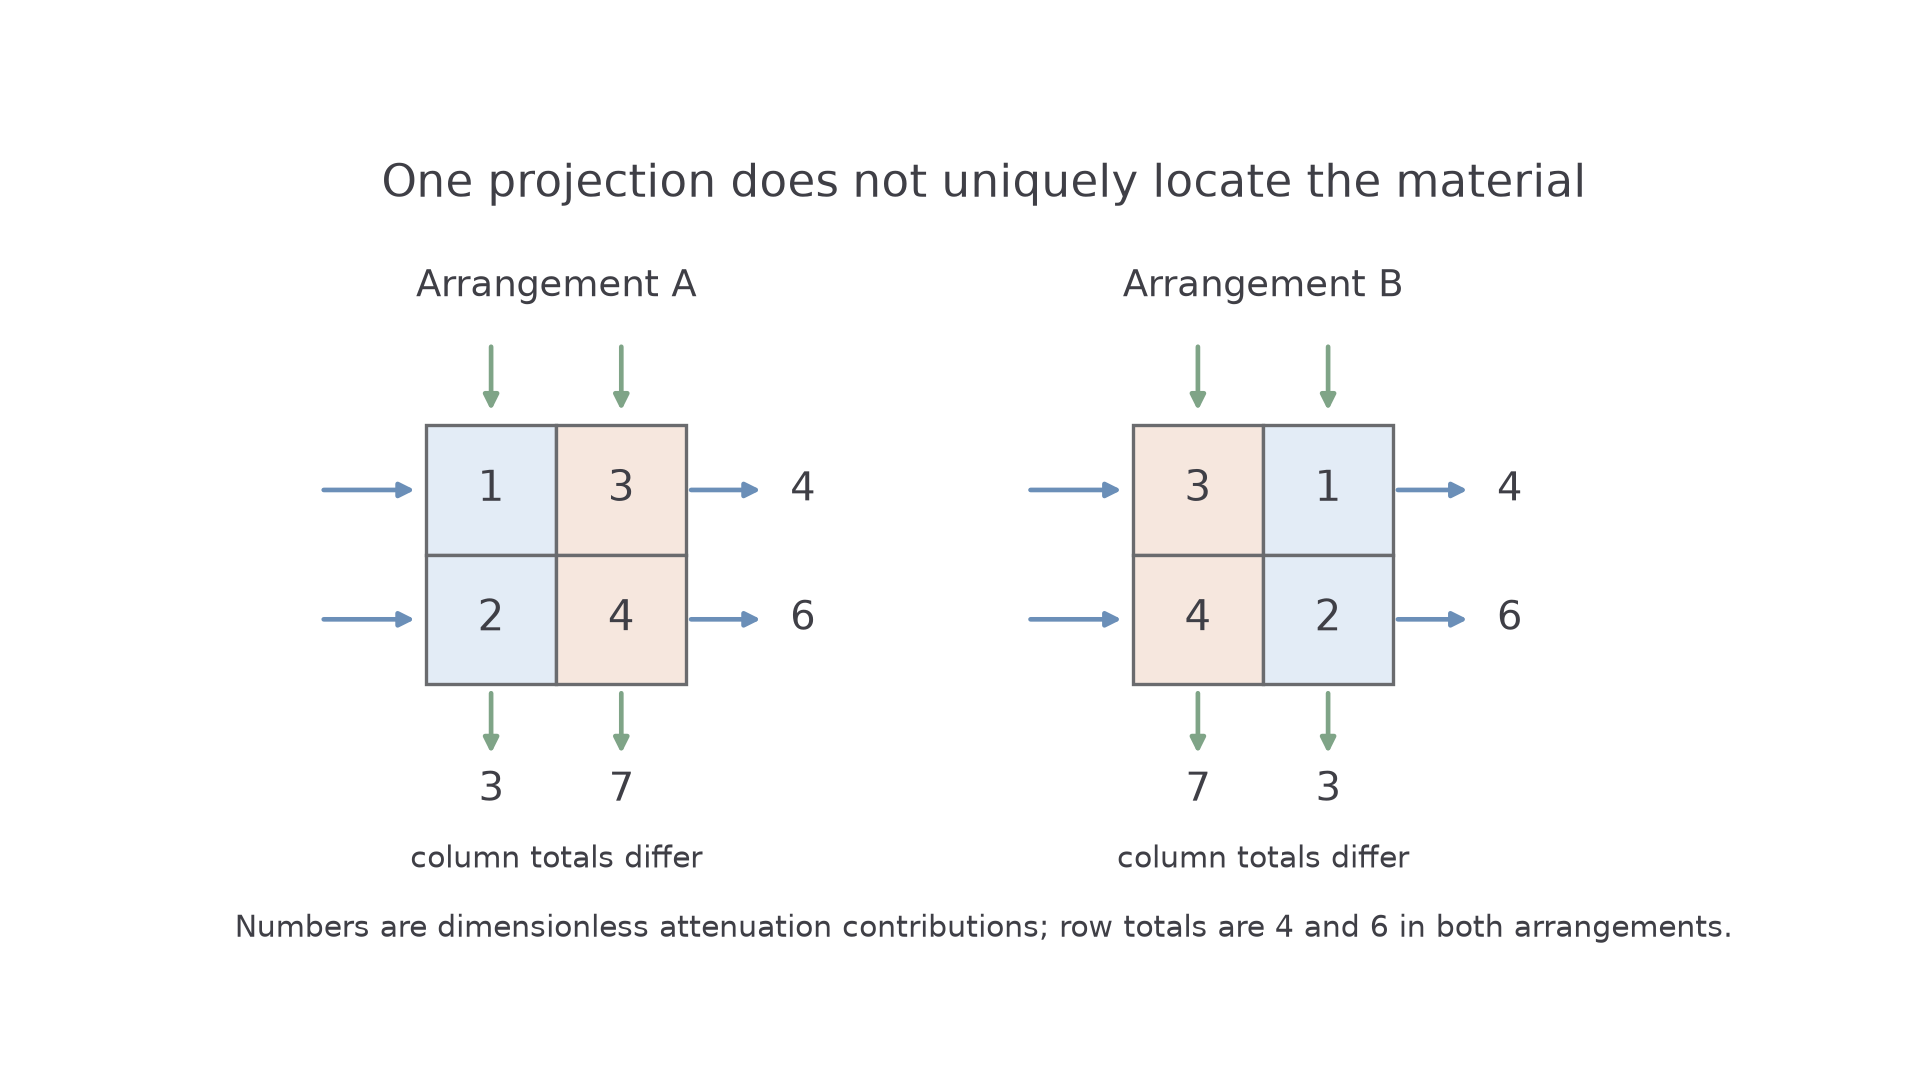
The totals correspond to the attenuation exponent, not to adding transmitted intensities. For successive cells, the measured transmission is a product of exponential factors. Taking the negative logarithm converts that product into a sum of their contributions. This explains why many measured paths contain information about the internal distribution. You do not need a reconstruction algorithm for this syllabus.
In a CT scanner, an X-ray source and detectors obtain transmission measurements through the same thin section from many angles around the body. A computer combines the angular projections to reconstruct a two-dimensional map of attenuation within that section. More than two views are needed for a realistic object; the two-grid example only distinguishes two stated possibilities.
Continue this lesson.
You’re previewing NovaLearn without an account. Create a free account to read the rest.
Create free account