7.1 - Oscilloscope traces and wave measurements
Use an oscilloscope's time-base and y-gain to determine a signal's period, frequency and voltage amplitude. Separate changes to the display from changes to the signal, and use a sensor calibration when a voltage represents a physical oscillation.
Time-base and frequency
Can the same sound appear to have a different frequency just because you turn a knob? Its trace can look stretched or squeezed, but the sound has not changed. You must read the oscilloscope's scales as well as the shape.
A cathode-ray oscilloscope, or CRO, displays a changing potential difference. The time-base sweeps the spot horizontally at a known rate while the input signal deflects it vertically. For a steady repeating signal, the screen shows a voltage–time graph. A triggered, stable display helps you identify corresponding points of successive cycles.
The time-base setting gives the time represented by each horizontal division, often in or . A division may be a centimetre square on a CRO grid; use the scale actually stated.
Period from an oscilloscope trace
Period is in seconds and frequency in hertz. Measure between equivalent points, such as successive positive peaks or successive rising zero crossings. A positive peak to a negative peak is only half a cycle for a sinusoid.
Not on the data sheet: learn it.
Worked example 1: one cycle across four divisions
Question. Successive peaks are 4.0 horizontal divisions apart. The time-base is . Determine the frequency.
Plan. Convert the horizontal separation into a period, then take the reciprocal.
Answer. .
Check. A two-millisecond cycle repeats 500 times in one second. Taking the reciprocal of 2.0 without converting milliseconds would give the wrong unit and value.
For improved precision, measure several complete cycles across a large fraction of the screen and divide their total time by their number. Count intervals, not peaks: four successive peaks enclose three cycles.
For example, three cycles span 9.0 divisions at . Their total duration is , so and .
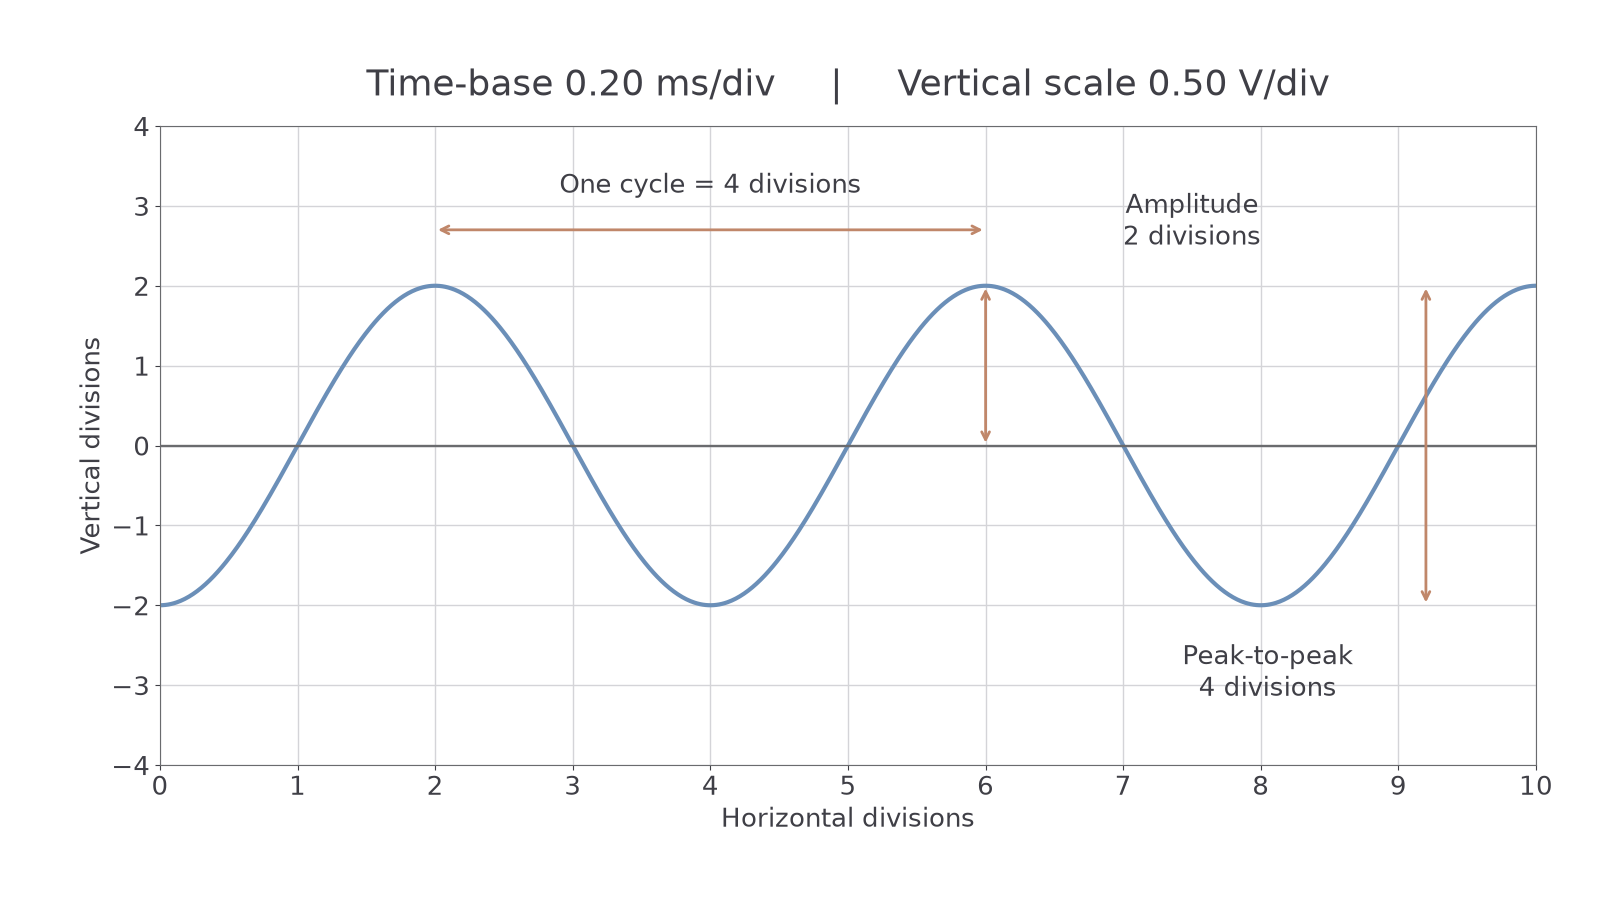
[DIAGRAM: asset_name: Reading an oscilloscope grid; asset_slug: cro-time-gain; caption: Count a complete cycle horizontally and measure amplitude from the signal's middle line; description: A sinusoidal CRO trace on a ten-by-eight division grid has period four horizontal divisions and amplitude two vertical divisions. A horizontal arrow marks one cycle and a vertical arrow marks amplitude from the middle line, with peak-to-peak height four divisions. The settings are time-base 0.20 milliseconds per division and vertical scale 0.50 volts per division.]
Vertical scale and amplitude
The CRO's vertical deflection represents input potential difference. Its calibrated vertical setting, commonly called y-gain, is often given as volts per division. Multiply a vertical distance on the grid by this setting to obtain a voltage difference.
The amplitude of a sinusoidal voltage is its maximum deviation from its middle value. The peak-to-peak voltage is the full difference between the positive and negative extremes, twice the amplitude.
Voltage amplitude from a trace
Equivalently, for a symmetric sinusoidal signal,
Here is voltage amplitude and is peak-to-peak voltage, both in volts. The signal's middle line need not coincide with the screen's zero-voltage line.
Not on the data sheet: learn it.
On the diagram, the amplitude is two divisions. With , it is ; the peak-to-peak voltage is . Taking the full four-division height as the amplitude would double the result.
Watch out
A lower setting in volts per division means a larger deflection for the same input voltage. It changes the display's sensitivity, not the source's amplitude. Recalculate using the new setting rather than comparing trace heights alone.
A microphone supplies an electrical signal related to sound. The CRO measures that signal's voltage amplitude. It cannot directly tell you the air-particle displacement or pressure amplitude without a suitable calibration. Likewise, a displacement sensor's voltage must be converted using its stated response.
Continue this lesson.
You’re previewing NovaLearn without an account. Create a free account to read the rest.
Create free account