7.1, 7.2 - Wave types and intensity
Compare transverse and longitudinal waves, interpret displacement graphs without mistaking them for pictures of particle paths, and calculate intensity from power and area. Relate a wave's intensity to the square of its amplitude under the same propagation conditions.
Oscillation direction and wave direction
Can a graph with an up-and-down curve describe sound whose air particles move backwards and forwards? Yes. The curve can represent a numerical displacement rather than the physical shape of the wave. First separate the oscillation direction from the propagation direction.
In a transverse wave, oscillations are perpendicular to the direction of energy transfer. Shake a stretched rope vertically and its disturbance travels horizontally while marked sections move vertically. Electromagnetic waves are also transverse, although their oscillating quantities are fields rather than material particles.
In a longitudinal wave, oscillations are parallel to the direction of energy transfer. Push and pull the end of a long spring along its length. Closely spaced regions, called compressions, alternate with more widely spaced regions, called rarefactions. Both patterns travel along the spring while individual coils move backwards and forwards.
Transverse and longitudinal waves
Transverse oscillations are perpendicular to propagation. Longitudinal oscillations are parallel to propagation. In both cases a progressive wave transfers energy, while particles of a mechanical medium oscillate locally in the ideal model.
Sound in air is longitudinal. Air particles oscillate along the sound's direction of travel, giving alternating pressure and density changes. A compression is a region of higher pressure and density; a rarefaction is a region of lower pressure and density. The whole packet of compressed air does not simply travel from the source to your ear.
Surface-water waves are a useful classroom illustration of propagation, but their particle motion generally combines horizontal and vertical motion. Do not claim that every water particle moves only vertically. A stretched rope and sound in air give cleaner models for the two categories.
Key idea
Classify a wave by comparing two directions: the local oscillation and the travelling disturbance. “The wave goes up and down” does not identify which direction you mean.
Reading transverse and longitudinal graphs
A graph's axis labels define its meaning. A transverse rope snapshot can resemble the rope itself: its vertical coordinate is a physical vertical displacement. A graph of longitudinal displacement can have the same mathematical shape while representing horizontal particle displacements.
For a longitudinal displacement–position graph, a positive ordinate might mean displacement to the right and a negative ordinate displacement to the left. It does not mean that air particles are above or below a line. The horizontal coordinate identifies position along the wave; the vertical coordinate records the signed displacement along the oscillation direction.
[DIAGRAM: asset_name: A sinusoid can describe longitudinal motion; asset_slug: longitudinal-displacement-density; caption: A longitudinal displacement graph is not a picture of a transverse particle path; description: A sinusoidal displacement-versus-equilibrium-position graph spans two wavelengths, each one metre. Positive displacement is explicitly labelled to the right. Below it a row of particles is shown at displaced positions, clustering at x equals 0.5 and 1.5 metres and spreading at x equals 0,1 and 2 metres. The clusters lie at downward zero crossings of the displacement curve, not at its crests.]
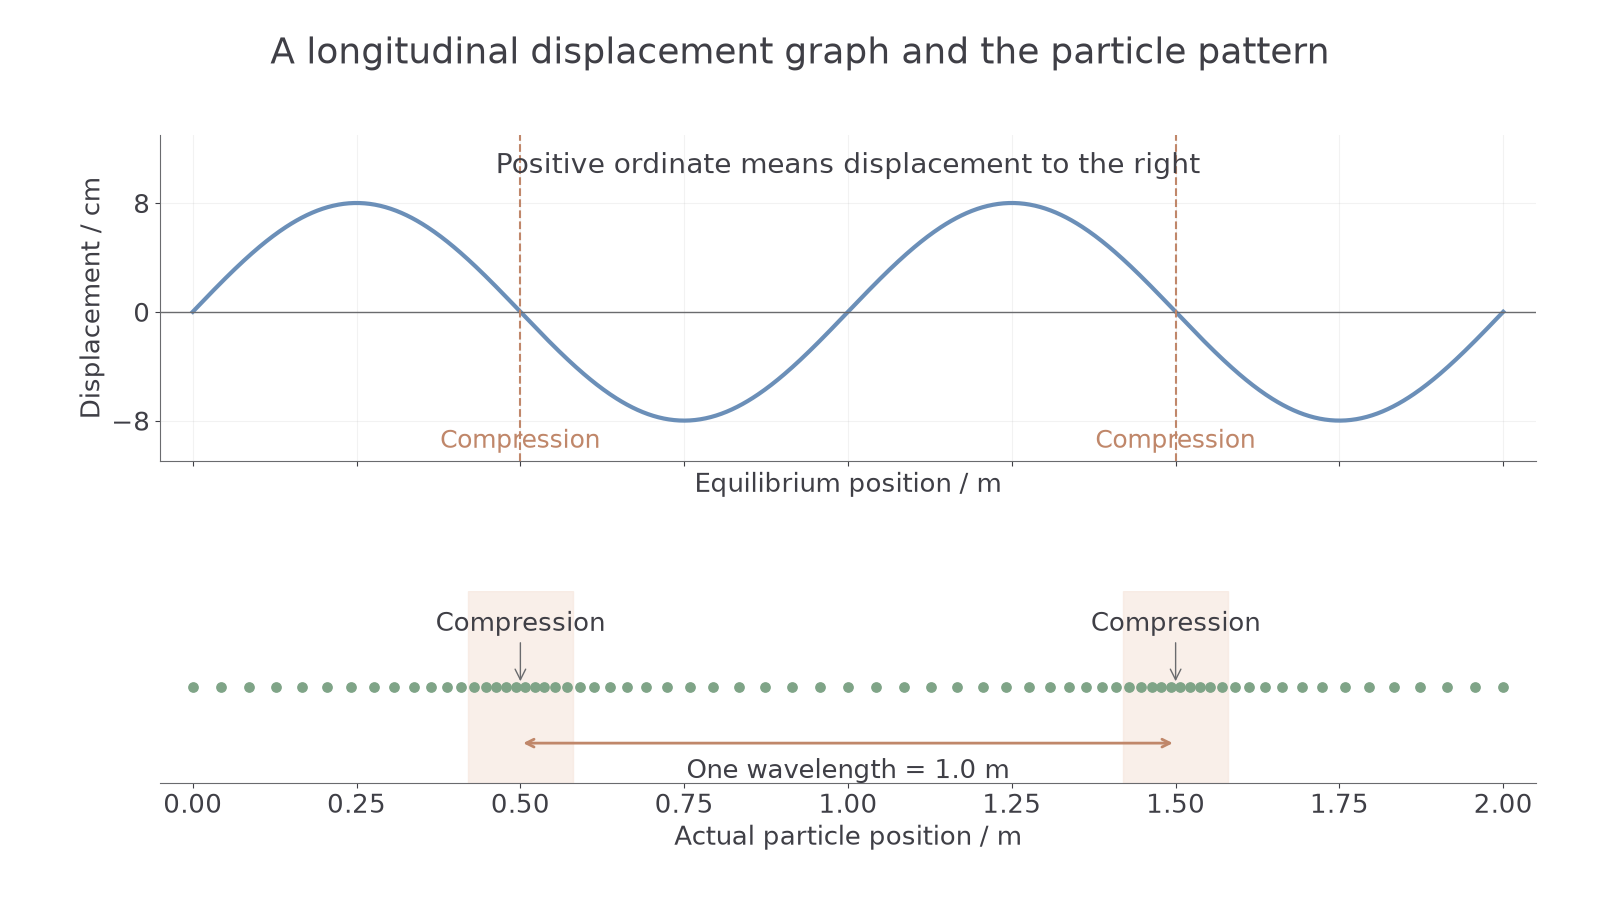
To locate a compression, compare neighbouring particles. Where the particle to the left is displaced right and the particle to the right is displaced left, they approach each other and density increases. On a sinusoidal displacement snapshot this occurs around a downward zero crossing. At a positive displacement maximum, neighbouring particles have similar displacements; that is not the centre of maximum compression.
A pressure–position graph is a different graph. Its positive maximum does identify maximum pressure, hence a compression. Do not transfer that rule to a displacement graph without checking what the ordinate means.
Watch out
A crest on a longitudinal displacement graph is a maximum particle displacement, not automatically a compression. A crest on a pressure graph is a maximum pressure. The same curve shape can describe different quantities.
In either wave type, wavelength is the spacing between equivalent repeating points: consecutive transverse crests, consecutive compressions, consecutive rarefactions, or equal-phase points on a displacement graph. A compression to the next rarefaction is half a wavelength for a sinusoidal longitudinal wave.
Continue this lesson.
You’re previewing NovaLearn without an account. Create a free account to read the rest.
Create free account