2.1 - Acceleration and velocity-time graphs
Learn to describe acceleration with a direction, find acceleration from a velocity–time gradient, and find displacement from the area under the graph. You will also use tangents and numerical areas when the acceleration changes.
Acceleration is a change in velocity
Can an object have zero velocity and still be accelerating? A ball thrown straight upwards does exactly that at its highest point. It is momentarily at rest, but its velocity is changing from upwards to downwards. In the ideal free-fall model, its acceleration remains downwards throughout.
Acceleration measures how quickly velocity changes. It is a vector, because velocity includes direction. A change in direction can therefore be an acceleration even when speed stays constant; you will explore that in circular motion at A Level.
Acceleration
Acceleration is the rate of change of velocity.
Choose the positive direction before calculating a signed change. If the initial velocity is and the final velocity is , the change is final minus initial, .
Average acceleration
Velocities and are in , time interval in seconds and average acceleration in . If acceleration is constant, this is its value throughout the interval. Otherwise it gives only the average over that interval.
Not on the data sheet: learn it.
Worked example 1: slowing down in a negative direction
Question. East is positive. A trolley's velocity changes from to in . Calculate its average acceleration.
Plan. Keep the velocity signs; the change is not the difference between the speeds with a minus sign added afterwards.
Answer. east.
Check. The trolley moves west and slows down, so its acceleration points east, opposite to its velocity.
Acceleration and velocity with the same sign mean increasing speed in straight-line motion. Opposite signs mean decreasing speed. “Negative acceleration” therefore does not automatically mean slowing down. A car moving west and speeding up has both negative velocity and negative acceleration if east is positive.
For the ball at the top, “zero velocity” describes that instant; “zero acceleration” would say that its velocity is not changing at that instant. These are different claims. Free fall without air resistance has acceleration approximately downwards near Earth's surface, whether the ball is rising, at the top or falling.
Gradients and areas of velocity-time graphs
A velocity–time graph puts velocity on the vertical axis. Its height therefore describes motion, while its gradient describes the change in that motion.
A straight section has constant acceleration, . A horizontal section has zero acceleration, even if its velocity is large. A downward slope has negative acceleration, whether the graph is above or below the time axis.
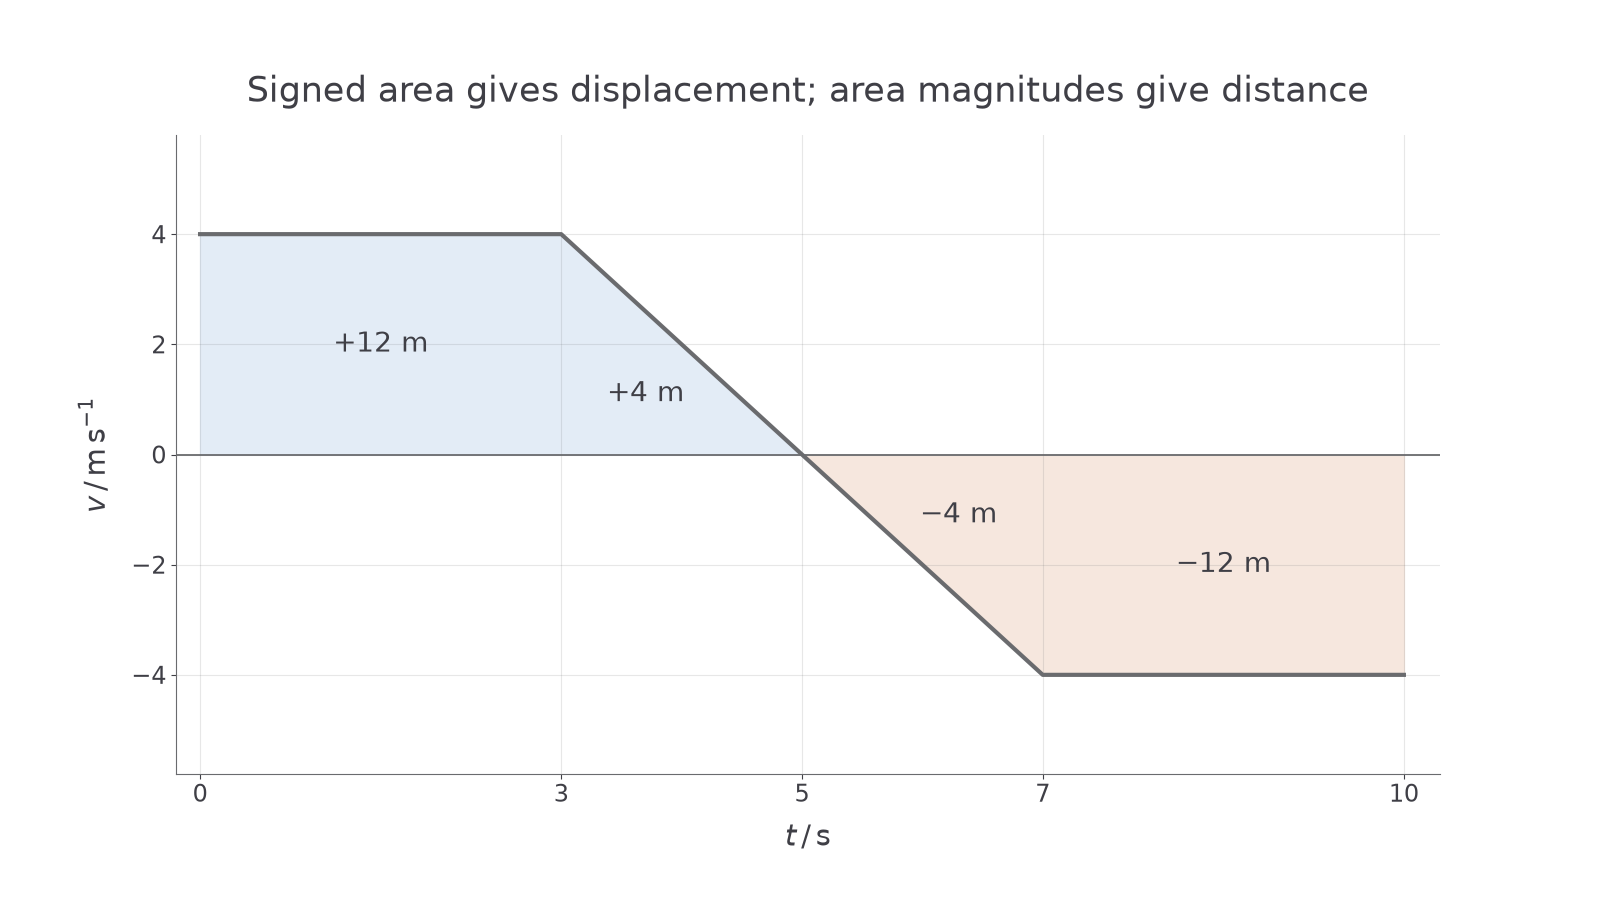
The area has a different meaning. For a constant velocity, a strip of width has area , which equals displacement. Adding strips gives the displacement for changing velocity too.
Displacement from a velocity-time graph
An area above the time axis is positive; an area below it is negative. The units are . Adding the magnitudes of all the areas gives total distance travelled. This graphical relationship applies to straight or curved graphs.
Not on the data sheet: learn it.
[DIAGRAM: asset_name: Signed areas on a velocity graph; asset_slug: motion-velocity-areas; caption: Equal positive and negative areas can give zero displacement without zero distance; description: A velocity-time graph runs horizontally from (0,4) to (3,4), slopes to (7,-4), then runs horizontally to (10,-4). Time is in seconds and velocity in metres per second. The slope crosses zero at 5 seconds. Areas above the time axis are pale blue and areas below are pale clay. The middle two triangles each have area magnitude 4 metres.]
Worked example 2: a reversal hidden in an area
Question. A velocity–time graph joins , , and by straight lines. Find the acceleration from to , the total displacement and the distance travelled.
Plan. Use the sloping section's gradient, then split the areas where velocity changes sign at .
Check. The object travels equally far in each direction. Zero displacement does not erase the journey.
A speed–time graph has no negative speed. Its area gives distance. Its gradient tells you the rate of change of speed; it is not enough to determine the vector acceleration when the direction of travel is changing.
Watch out
Below the axis does not mean slowing down. On the descending section after , velocity and acceleration are both negative, so the speed increases.
Use a fresh graph described completely by coordinates.
Changing acceleration and curved graphs
When a velocity–time graph curves, acceleration changes. A single end-to-end gradient then gives an average acceleration, which may differ from the acceleration at the instant you want.
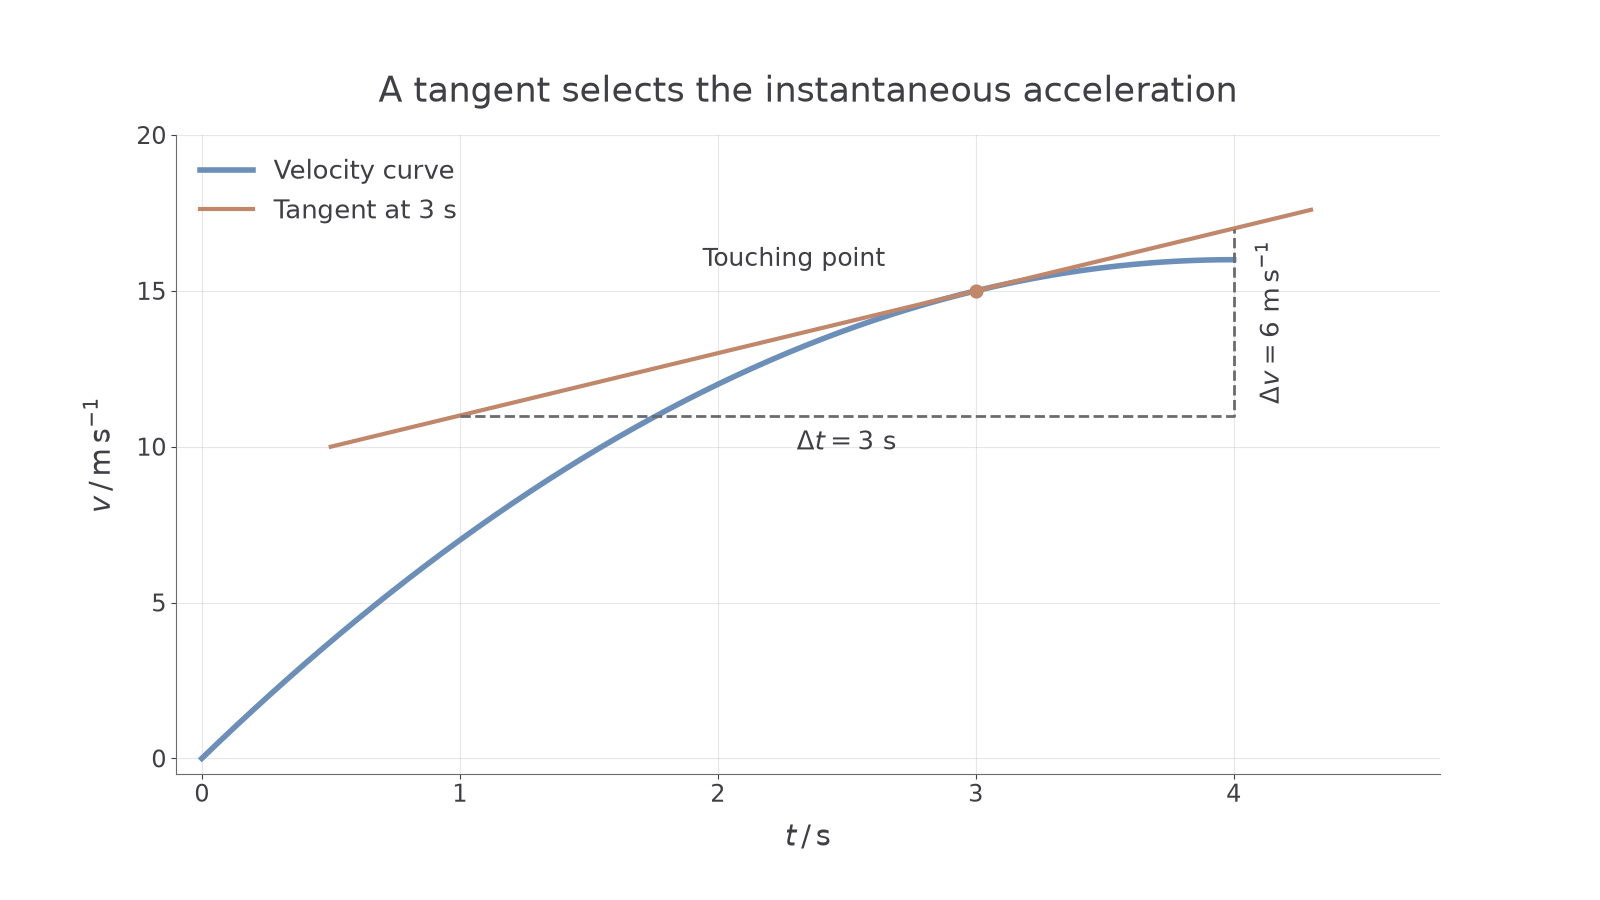
To find instantaneous acceleration, draw a tangent at the required point. Choose two widely separated points on the tangent and divide the velocity difference by the time difference. The triangle belongs to the tangent, rather than the curve. There is no need to differentiate an equation to use this method.
[DIAGRAM: asset_name: A tangent gives instantaneous acceleration; asset_slug: motion-tangent-acceleration; caption: The curve's height is velocity; the tangent's gradient is acceleration; description: A velocity-time curve v equals 8t minus t squared is plotted from 0 to 4 seconds, with velocity rising from 0 to 16 metres per second and becoming less steep. At (3,15), a clay tangent v equals 2t plus 9 is drawn. A dashed triangle uses tangent points (1,11) and (4,17), with changes 3 seconds and 6 metres per second.]
Exam-style example: use the tangent rather than the origin
Question. At , a tangent to a velocity–time curve passes through and . Determine the acceleration at .
The velocity at the touching point is , but dividing by would give a different quantity: the average acceleration from rest at time zero. The tangent selects the local rate of change.
The displacement under a curved graph can be estimated with narrow trapezia. For successive speeds and , a strip of width has area approximately . Here each velocity is in , so the strip gives displacement in metres. This geometric estimate is not on the data sheet: learn the area method. Make strips narrower where the curvature is stronger; do not pretend a changing curve is one straight line.
For example, a positive velocity curve has readings at . Four one-second trapezia give
This is an approximation based on the supplied samples. The actual curved graph need not pass along each straight strip edge. If the graph crosses zero, split or account for signed areas before deciding whether you want displacement or distance.
Quick Recap
- Acceleration is the rate of change of velocity, with a direction.
- The gradient of a velocity–time graph is acceleration; a tangent gives its instantaneous value on a curve.
- Signed area gives displacement; adding area magnitudes gives distance.
- Compare acceleration with velocity to decide whether speed is increasing or decreasing.
At the top of an ideal vertical throw, velocity is zero but downward acceleration is not: the velocity is still changing from upwards to downwards.