25.3 - Redshift, Hubble's law and the Big Bang
Use identified spectral lines to measure redshift, apply the small-speed approximation and Hubble's law in SI units, and explain the evidence for expansion from a hotter, denser past.
Identified lines and redshift
A galaxy shows the familiar line pattern of an element, but its identified lines have longer wavelengths than in the laboratory. How can those lines reveal an expanding Universe? The comparison starts with recognising which lines belong together, rather than calling every reddish object a receding galaxy.
Emission and absorption lines have known rest wavelengths. Matching a pattern of several lines lets us compare the received wavelengths with those emitted by the same transitions in the laboratory. A shift towards longer wavelengths is a redshift; a shift towards shorter wavelengths is a blueshift.
A redshift need not make a whole object visibly red. It is a comparison of wavelengths. An ultraviolet line can be redshifted while remaining ultraviolet. Nor does “shifted to a greater wavelength” mean that the measured wavelength must keep increasing during an observation.
[DIAGRAM: asset_name: Corresponding spectral lines identify a redshift; asset_slug: cosmology-redshift-lines; caption: The same fractional wavelength increase shifts longer-wavelength lines by a greater absolute amount; description: Two supplied-model absorption spectra share a wavelength axis in nanometres. Laboratory lines at 400, 500 and 650 nanometres correspond to received lines at 408, 510 and 663 nanometres. Every line has redshift 0.020, although the absolute shifts are 8, 10 and 13 nanometres. Each spectrum has a dimensionless relative-intensity axis; the data are a supplied model, not measured values for a named galaxy.]
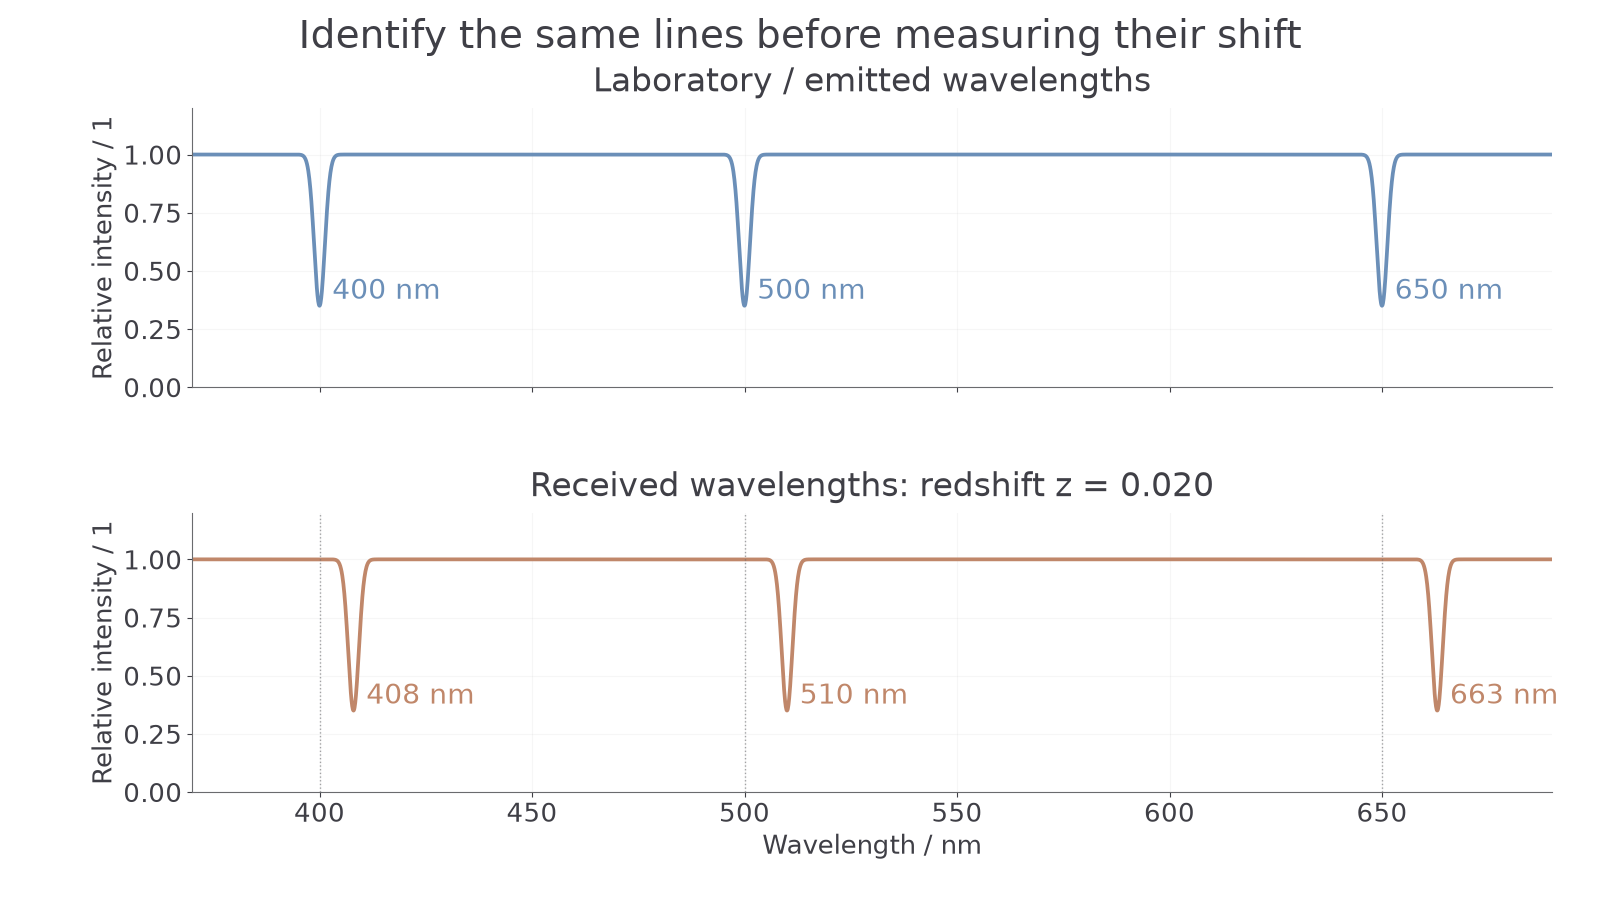
For an emitted wavelength and received wavelength , define . The fractional wavelength increase is the dimensionless redshift . Its sign matters: recession gives positive in the simple radial-motion model.
Small-speed electromagnetic Doppler shift
Here is the source's radial recession speed in , is light speed in , and and are the emitted/rest wavelength in m and frequency in Hz. For these displayed positive recession magnitudes, , while is the frequency decrease. These approximations apply when is much smaller than , corresponding to small redshift.
On the data sheet. Paper 4 only.
If you instead define a signed frequency change as observed minus emitted frequency, that change is negative for recession. Wavelength increases while frequency decreases because ; the two signed changes cannot both be positive.
Worked example 1: speed from a line shift
Question. A line emitted at is received at . Estimate the radial recession speed using the small-speed relation and .
Plan. Divide the wavelength difference by the emitted wavelength, then multiply by .
Check. The inferred speed is , so it is small compared with light speed. The nanometre factors cancel in the wavelength ratio. Mixing nanometres in the numerator with metres in the denominator would not be valid.
Model limit
For very large cosmological redshifts, do not turn into a recession speed using . Expansion during light's journey needs a fuller cosmological model. The course calculations here use the small-shift approximation within its stated limit.
Use the frequency version with its direction made explicit.
Expansion and a hot early Universe
Spectra of many distant galaxies show systematic redshift. Their received wavelengths are greater than the corresponding rest wavelengths. Together with the distance–recession relationship developed next, this leads to a large-scale picture in which galaxies become farther apart as the Universe expands.
Expansion is not evidence that Earth is at a special centre. In a uniformly expanding distribution, observers in other galaxies would also find that distant galaxies generally recede from them. Local gravitational motions can still make some nearby systems approach; the broad large-scale trend is what matters. This model concerns large-scale separations, rather than every gravitationally bound system swelling.
[DIAGRAM: asset_name: Expansion increases separations without a special central galaxy; asset_slug: cosmology-expanding-pattern; caption: Enlarging all separations gives the same recession pattern from different chosen galaxies; description: Two maps show the same labelled galaxies with every separation enlarged by a common factor between the earlier and later map. A chosen observer is marked on an off-centre galaxy. A short comparison shows that the more distant galaxy has a greater separation increase over the same interval. A note states that no centre of the Universe is identified by the diagram; map positions and sizes are schematic.]
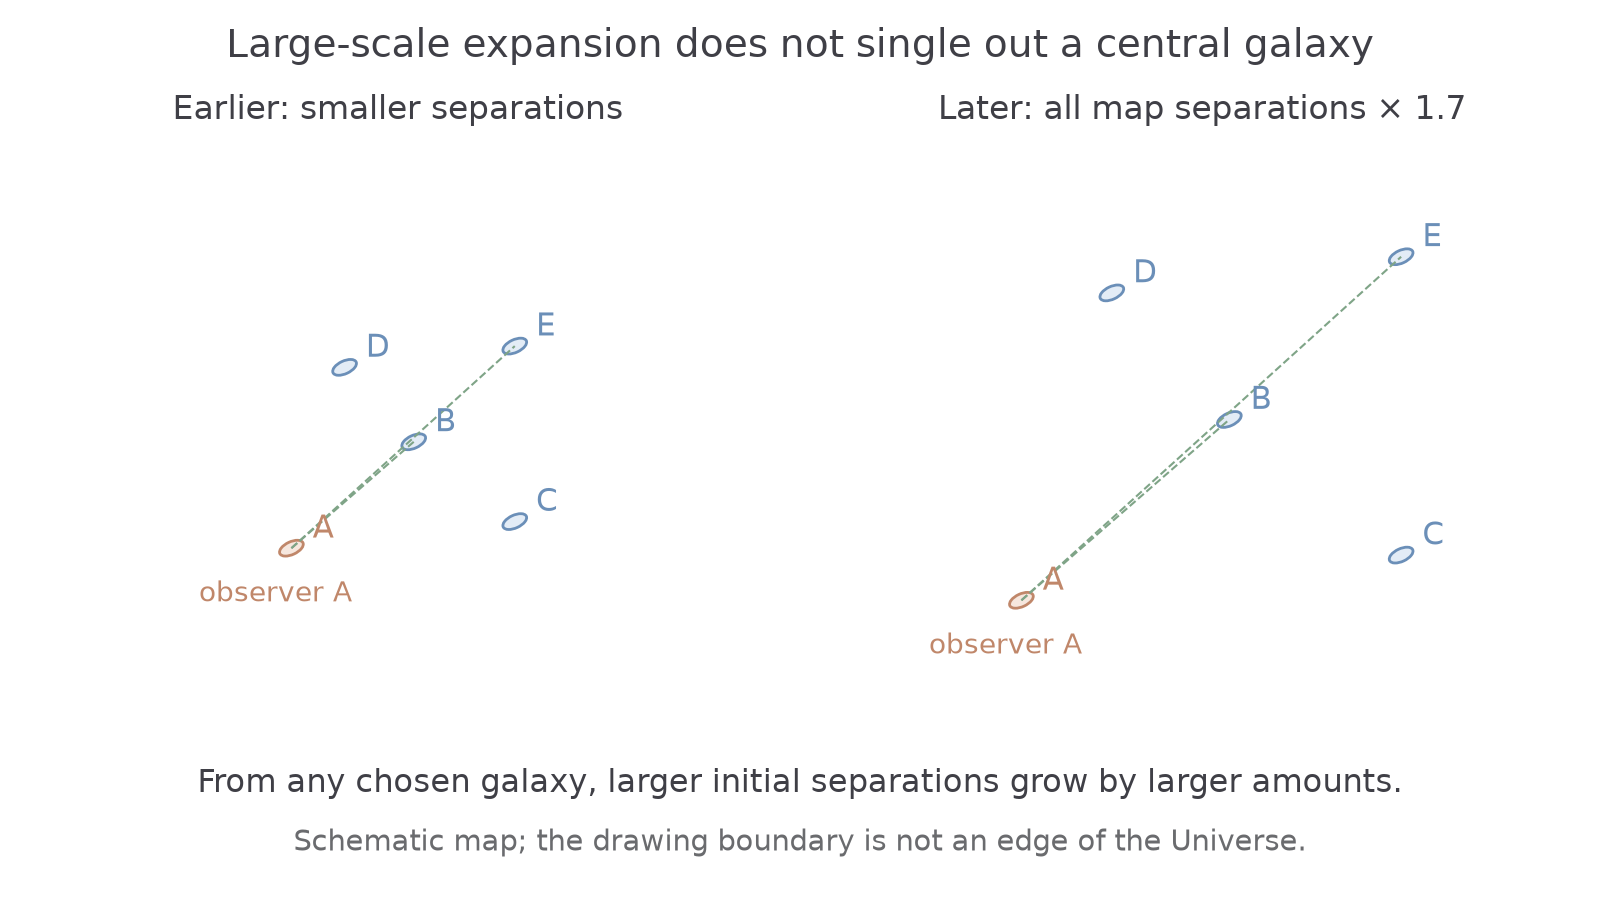
For cosmological light, expansion of space stretches the wavelength during its journey. The small-speed Doppler expression is a useful approximation for the small redshifts used here, but the large-scale model does not require an explosion through pre-existing empty space with Earth at its centre.
Run the expansion backwards in the model: typical separations were smaller and matter was more densely packed. The hot Big Bang model describes an early hot, dense Universe that expanded and cooled. Redshift establishes expansion evidence; an additional observation supports the hot part of that history.
Continue this lesson.
You’re previewing NovaLearn without an account. Create a free account to read the rest.
Create free account