2.1 - Displacement, velocity and motion graphs
Learn to distinguish the route travelled from the change in position, calculate average speed and velocity, and read velocity from a displacement–time graph. These distinctions let you describe a journey without confusing “moving” with “getting further from the start”.
Distance and displacement
Can you run a whole lap and still have zero displacement? Yes: the finish line can also be the start line. You have travelled a distance, but your final position is your initial position. A quantity describing the route and a quantity describing the change in position must therefore be different.
Distance travelled is the total length of the path followed. It is a scalar: its magnitude is sufficient. Displacement is the change in position from the initial point to the final point, including direction. It is a vector. Both are measured in metres, but sharing a unit does not make them the same quantity.
Displacement
Displacement is the change in position of an object in a specified direction.
In straight-line motion, choose one positive direction and keep it. If east is positive and a person moves from position to position , their displacement is . A negative result means west, rather than a negative length of path. This relation is not on the data sheet: learn it. The symbols , and are lengths in metres.
[DIAGRAM: asset_name: A route and its displacement; asset_slug: motion-route-displacement; caption: Distance counts both legs; displacement joins the start to the finish; description: A straight east-west axis has positions 0, 20 and 60 metres. A blue arrow runs from 0 to 60 metres, then a clay arrow returns from 60 to 20 metres. Below, a sage arrow runs from 0 to 20 metres, labelled displacement 20 metres east. The two route legs total 100 metres.]
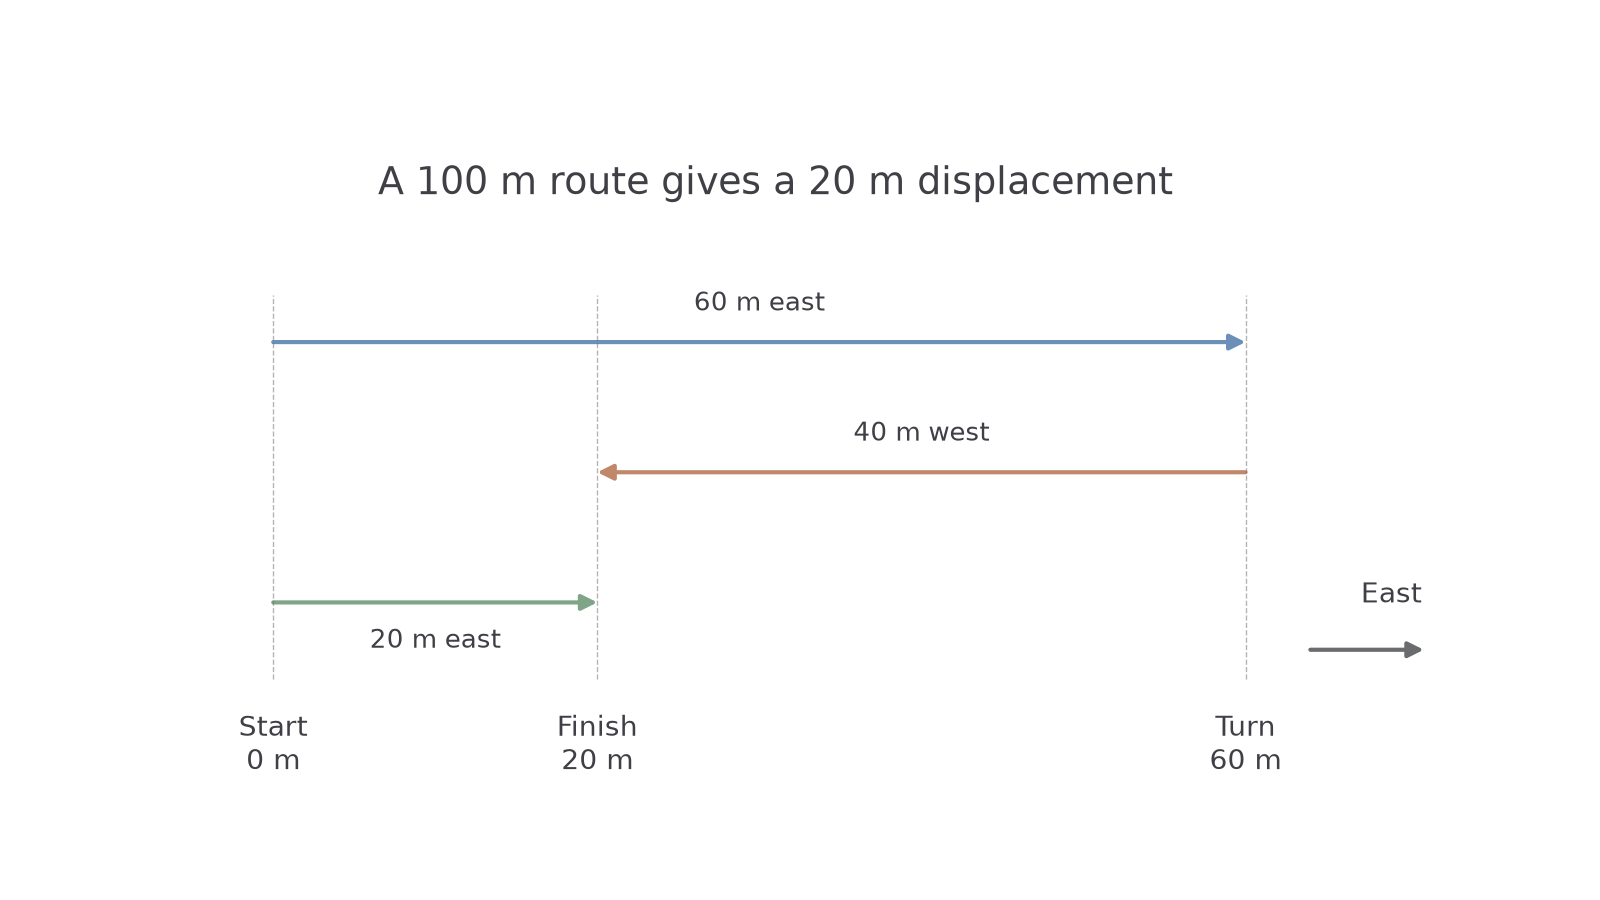
For the journey in the diagram, the distance is , while the displacement is , or east. Reversing direction adds to the distance travelled but can reduce the magnitude of displacement.
In two dimensions, displacement is the straight arrow from start to finish, even if no part of the actual route follows that arrow. For example, a walk north and then east covers . Its displacement magnitude is , directed north of east. The vector methods you already know supply the direction.
Watch out
A negative displacement means a change of position opposite to your chosen positive direction. Distance travelled is never negative. State your direction convention before attaching signs.
Use that distinction on a fresh route.
Speed and velocity
A speedometer tells you how quickly you are travelling along your path. It does not tell you whether you are approaching home or moving away from it. Velocity supplies that missing direction.
Speed and velocity
Speed is the rate of change of distance travelled. Velocity is the rate of change of displacement. At an instant, speed is the magnitude of velocity.
Over a finite interval, use the total change during the whole interval. A pause counts towards the elapsed time even though it adds no distance.
Average speed and average velocity
Distance and displacement change are in metres; elapsed time is in seconds. Both rates have unit . Average velocity needs a direction or a sign convention. These definitions apply whether the motion is uniform or changing.
Not on the data sheet: learn it.
The average describes the whole interval. Instantaneous velocity describes one instant; it is what the displacement changes by per unit time over an interval made very short around that instant. A moving runner can have zero average velocity over a lap, while their instantaneous velocity is non-zero for almost the entire lap. That is a consequence of returning to the same position, not a claim that they stood still.
Worked example 1: a journey with a reversal
Question. A person walks east, then west. The whole journey takes . Calculate the average speed and average velocity.
Plan. Use the same total time, but different numerators.
Answer. Average speed ; average velocity east.
Check. The return leg increases the path length but reduces the displacement, so the average speed exceeds the magnitude of average velocity.
Do not average two speeds unless their time weightings justify it. A cyclist covers at and another at . The times are and , so the average speed is , not . More time is spent at the lower speed.
Velocity from displacement-time graphs
A displacement–time graph records where the object is relative to an origin at each time. Its height gives displacement; its slope tells you how quickly displacement is changing.
For a straight section, determine the velocity using two well-separated points on the line:
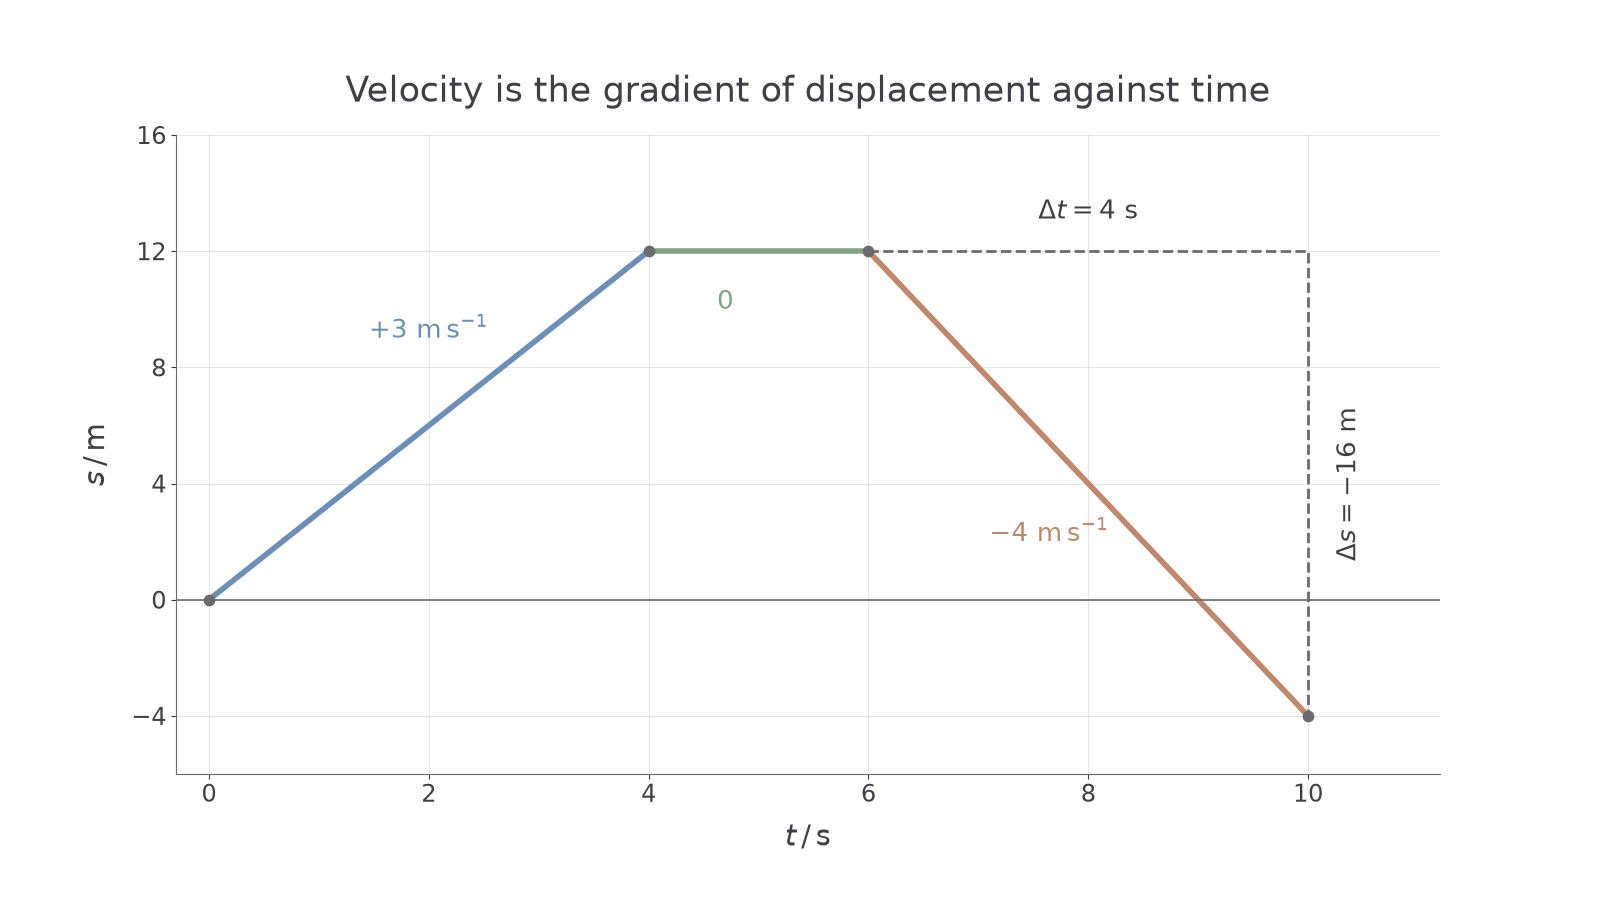
Here is velocity in , is the change in displacement in metres and is elapsed time in seconds. This gradient relation follows from the definition of velocity and is not on the data sheet: learn it. A positive gradient means positive velocity; a horizontal section means zero velocity; a negative gradient means negative velocity. A steeper gradient in magnitude means greater speed.
[DIAGRAM: asset_name: Displacement and slope; asset_slug: motion-displacement-graph; caption: The three straight sections have velocities 3, 0 and minus 4 metres per second; description: Displacement-time graph with axes t in seconds and s in metres, connecting points (0,0), (4,12), (6,12) and (10,-4). Blue marks the rising section, sage the horizontal section and clay the falling section. A dashed gradient triangle on the final section spans 4 seconds and minus 16 metres.]
Exam-style example: a graph that crosses the origin
Question. A displacement–time graph has straight sections joining , , and . Determine the velocity at .
Plan. That time lies on the final straight section, so use that section's gradient.
Answer. .
Check. The displacement decreases steadily, so the velocity must be negative. The displacement at is still positive; position and direction of motion need not have the same sign.
For a curved graph, the gradient changes. Draw a tangent at the required instant and calculate its gradient using a large triangle on the tangent, rather than two nearby data points on the curve. This gives instantaneous velocity. A chord joining two different times gives an average velocity instead.
A distance-travelled–time graph cannot decrease, because total path length does not get undone. Its gradient gives speed. A graph of distance from a particular point can decrease, so read the axis wording carefully.
Exam tip
Say “gradient” when extracting velocity from displacement–time. Dividing the graph height by the time is correct only for the average from a zero-displacement start, not a general instantaneous velocity.
Check the signs using a complete set of coordinates.
Quick Recap
- Distance counts the path length; displacement is the directed change in position.
- Average speed uses total distance; average velocity uses displacement, both divided by total elapsed time.
- Velocity is the gradient of a displacement–time graph; use a tangent for an instantaneous value on a curve.
- A negative displacement and a negative velocity describe different things: position relative to the origin and direction of motion.
A full lap can have zero displacement, and hence zero average velocity, because you finish where you started even though you travelled a non-zero distance.