23.2 - Random decay, activity and half-life
Explain why individual radioactive decays are unpredictable while large samples follow a predictable trend. Distinguish activity from detector count rate, correct for background, and use half-life and exponential decay to calculate the remaining nuclei or measured signal.
Unpredictable decays and fluctuating counts
A long-half-life source gives 94 counts in one minute and 111 in the next. Does the higher second count mean that the source has become more active? A detector counts individual events, and even a source with effectively constant activity over these two minutes need not give equal counts.
Radioactive decay is the spontaneous emission of ionising radiation from an unstable nucleus. Two separate ideas describe it:
Spontaneous and random decay
Spontaneous means that the decay occurs without an external trigger; it is not caused by the nucleus colliding with another particle or being heated.
Random means that it is impossible to predict which particular nucleus will decay, or exactly when it will decay. Its probability of decay in a given short time interval can nevertheless be specified.
Under ordinary conditions, changing a sample's temperature, pressure or chemical state does not provide a useful way to control its nuclear decay rate. Do not confuse heating an atom so that it emits light with changing its nucleus by radioactive decay.
What a counter shows
Place a detector at a fixed distance from a long-half-life source and count over equal intervals. Keep the geometry, absorber arrangement and counter settings unchanged. A sequence such as 102, 94, 111, 97, 105, 91, 109, 98 counts in successive one-minute intervals fluctuates without a steady rise or fall. Read the sequence as counts fluctuating around a mean, rather than as eight precise measurements of activity.
[DIAGRAM: asset_name: Equal intervals do not give equal counts; asset_slug: nuclear-random-counts; caption: Counts fluctuate about a mean even when the source activity changes negligibly during the observation; description: A bar chart shows 102, 94, 111, 97, 105, 91, 109 and 98 counts in eight equal one-minute intervals. A horizontal mean line at 100.875 counts is labelled about 101 counts per minute. A note states that geometry and counter settings are fixed and source half-life is much longer than eight minutes.]
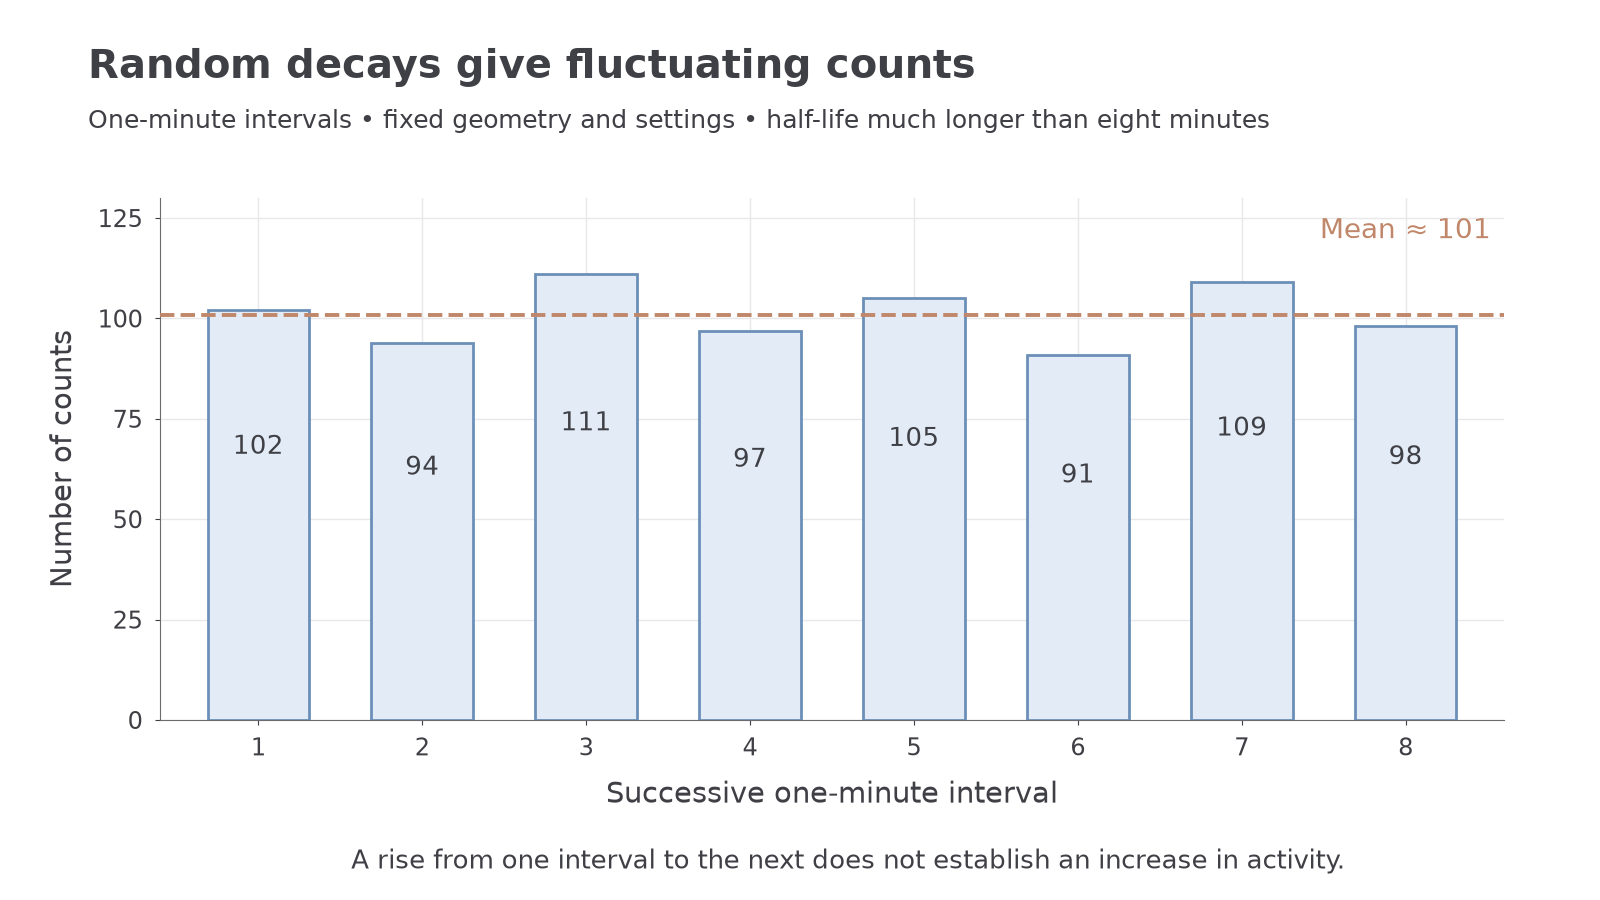
The fluctuations provide evidence for random decay. A single increase is not evidence that the source's underlying activity increased. Longer counts and repeated readings give a more reliable mean rate, although they do not make individual decays predictable. If the source changes appreciably during a long count, that count instead averages over its changing activity.
The detector also registers background radiation. Measure it with the source removed, using the same counter settings, for a sufficiently long time to obtain a useful mean. Convert both readings to the same time unit before subtraction:
This subtraction is not a supplied data-sheet formula; it is the measurement model. Background fluctuates too. A total of 600 counts in 120 seconds is . A separate background count of 120 in 300 seconds is , so the corrected source count rate is . Subtracting the raw counts 600 and 120 would mix unequal counting times.
Model limit
The source's count rate is proportional to its activity only when detection conditions remain the same. Keep source–detector geometry and absorption fixed, and use rates low enough that the detector's inability to register very closely spaced events is negligible. Some emitted radiation is never detected.
Activity and probability per unit time
A sample with many undecayed nuclei offers many opportunities for decay. If each surviving nucleus has the same constant probability of decay per unit time, the mean number of decays per second is proportional to the number of surviving nuclei. The nucleus does not become “due” to decay because it has survived a long time.
Activity and decay constant
The activity of a sample is the rate at which its nuclei decay: the number of decays per unit time. Its SI unit is the becquerel, with .
The decay constant is the probability of decay per unit time for an individual undecayed nucleus. Its SI unit is .
For a sufficiently short interval , the probability that a surviving nucleus decays is approximately . This approximation needs much less than 1. Multiply that probability by the number of available nuclei to obtain the expected number of decays in the interval; dividing by gives the activity.
Activity of a sample
Here is the activity in , the decay constant in and the number of undecayed nuclei of the specified radionuclide. This is the statistical decay rate for independent nuclei with the same constant decay probability. Measured short-interval counts fluctuate around their expected values.
Not on the data sheet: learn it.
Worked example 1: many nuclei, small probability
Question. A sample contains undecayed nuclei of a radionuclide with . Calculate its activity and the approximate probability that one nucleus decays within the next second.
The one-second probability is approximately . A tiny chance per nucleus can therefore give a large activity when there are many nuclei.
Check. The expected fraction decaying in that second is very small, so treating the activity as approximately constant during one second is consistent.
Why activity is not detector count rate
Activity counts decays in the source; corrected count rate counts registered events at the detector. Radiation is emitted in different directions, some is absorbed before reaching the detector, and not every arrival registers a count. In a fixed arrangement, write corrected count rate as , where is a constant detection factor for that source and apparatus. This proportionality is a measurement model, not a general supplied formula. Do not assume that , or calculate from a detector rate without the needed detection information.
Watch out
is the number of nuclei still undecayed, not the total number that have decayed since the start. As decreases, activity decreases; the decay constant of the radionuclide stays the same. A count rate in is not automatically an activity in just because the dimensions agree.
Half-life and repeated halving
Although the next individual decay cannot be timed, a large sample follows a regular statistical pattern. The same fraction of its surviving nuclei is expected to decay in each equal time interval. This produces repeated halving, rather than equal numbers disappearing in equal intervals.
Half-life
The half-life is the time taken for the number of undecayed nuclei of a radionuclide in a sample to decrease to half its initial value. Equivalently, it is the time for its activity to halve.
Continue this lesson.
You’re previewing NovaLearn without an account. Create a free account to read the rest.
Create free account