22.4 - Atomic energy levels and line spectra
Use discrete electron energy levels to explain emission and absorption spectra, interpret transition diagrams, and calculate photon frequencies and wavelengths from energy differences.
Allowed electron energy levels
A low-pressure gas excited in a discharge tube gives sharp spectral lines rather than a smooth spread of every wavelength: why are particular colours selected? Isolated atoms have discrete electron energy levels, so only particular energy differences are available for photon transitions.
An electron bound in an isolated atom, such as atomic hydrogen, cannot take an arbitrary energy. An energy level is an allowed electron energy state. The lowest available state is the ground state; higher allowed states are excited states.
An atom can gain energy in a collision or by absorbing suitable radiation and become excited. When its electron moves to a lower allowed state, energy can be transferred out as a photon. These transitions change energy; an energy-level diagram is not a picture of an electron dropping between physical shelves.
Discrete energy levels
Discrete energy levels are separated allowed electron energy states, rather than a continuous range of bound-state energies.
A vertical energy axis often uses zero for an electron no longer bound to the atom, with bound levels shown as negative values. A less negative level is higher in energy. For example, is above ; moving down between them releases a positive difference of .
[DIAGRAM: asset_name: Energy levels represent energy rather than spatial orbits; asset_slug: quantum-atomic-levels; caption: Downward transitions release an energy difference; the vertical separation is an energy scale; description: A supplied model atom has horizontal levels at minus 5.0, minus 2.0 and minus 1.0 electronvolts, below a zero-energy reference. A downward arrow from minus 2.0 to minus 5.0 electronvolts is labelled emitted photon energy 3.0 electronvolts. An upward arrow shows absorption for the same gap. The energy axis is in electronvolts, and a note states that the diagram is not a drawing of spatial orbits.]
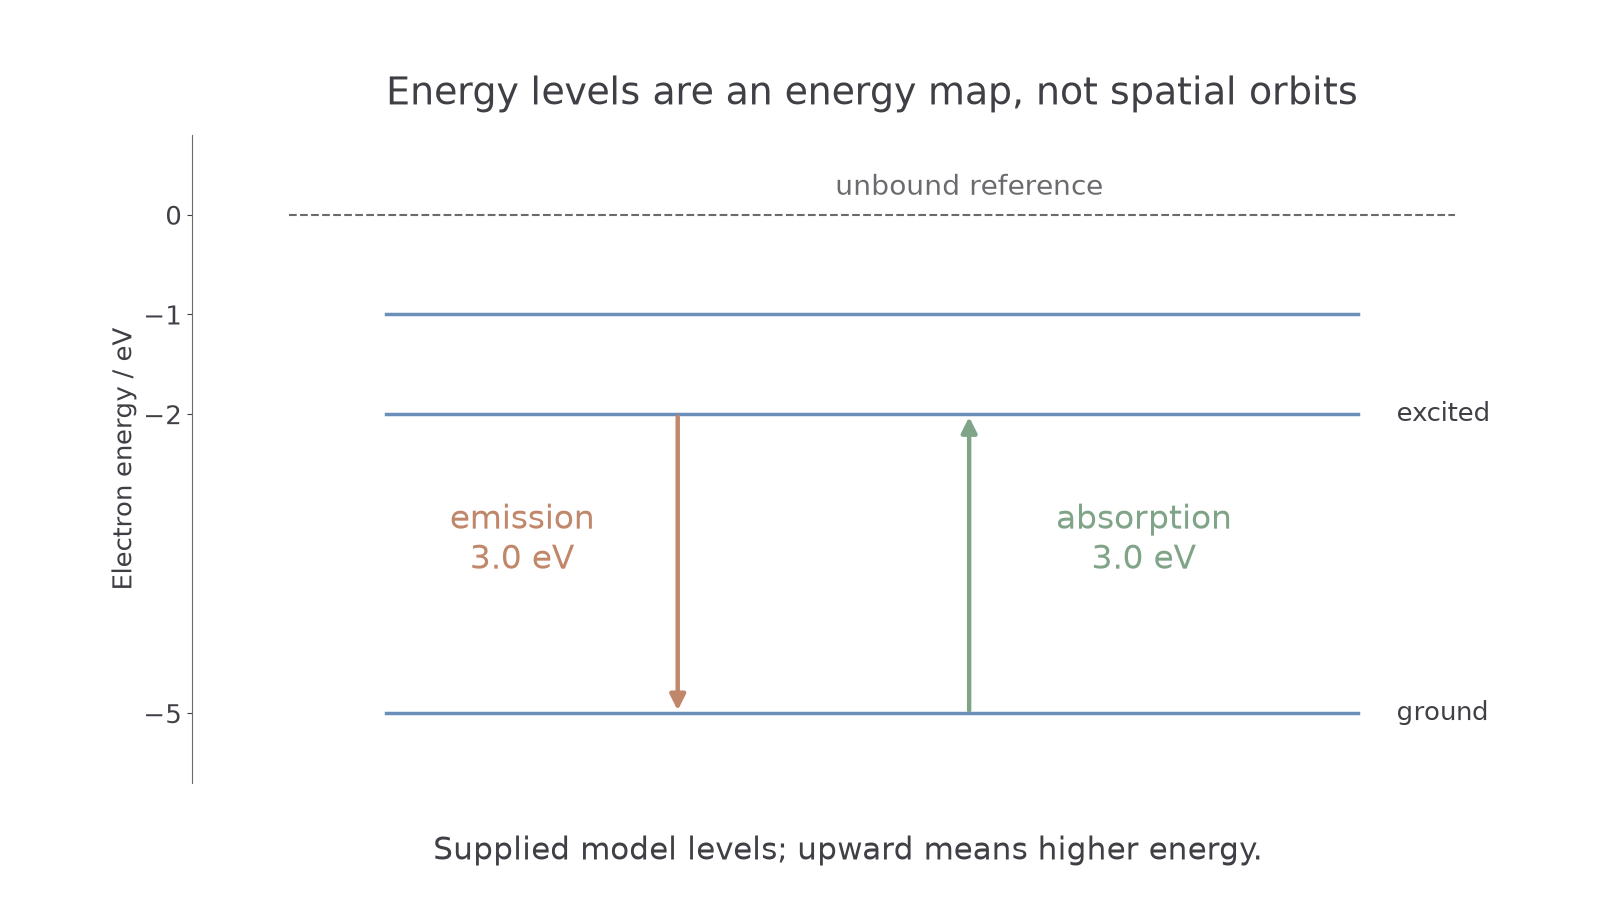
An electron cannot absorb an arbitrary small amount and remain halfway between the allowed bound levels. In the simple isolated-atom transition model, absorption must match an available energy difference. The initial level must also be occupied and the final level accessible; a list of gaps alone does not guarantee that every transition is populated in every experiment.
Model limit
These sharp-level diagrams describe isolated atoms. Interactions in solids and dense matter can change the available energy structure and broaden spectral features, so do not apply one isolated-atom picture to every glowing material.
Use a supplied two-level model rather than guessing a continuous intermediate state.
Emission and absorption line spectra
In an excited low-pressure gas, electrons can move from occupied higher levels to lower allowed levels. Each photon carries the difference in energy. A particular gap therefore gives a particular photon frequency and wavelength, producing a line rather than a continuous range from that transition.
An emission line spectrum consists of bright lines at the wavelengths emitted by these transitions. Different elements have different level structures, so their line patterns can help identify them. There can be many lines because there can be many permitted transitions and many excited atoms.
An absorption line spectrum arises when a continuous source is viewed through a cooler, low-pressure gas. Atoms absorb photons whose energies match transitions from occupied lower levels to accessible higher ones. Those wavelengths are reduced in the transmitted beam and appear as dark lines against the continuous spectrum.
The schematic below uses the three supplied levels shown earlier. The emitting sample contains excited atoms, while atoms in the absorbing sample are assumed to occupy the lowest level. That population condition changes which gaps can absorb appreciably.
[DIAGRAM: asset_name: Energy gaps and level populations select spectral lines; asset_slug: quantum-emission-absorption; caption: The same gaps give matching wavelengths, but absorption also needs atoms in the lower level; description: Two relative-intensity spectra share a wavelength axis in nanometres. For the supplied levels minus 5.0, minus 2.0 and minus 1.0 electronvolts, emission peaks occur near 311, 414 and 1243 nanometres. Absorption from the lowest level gives dips near 311 and 414 nanometres; no appreciable 1243-nanometre dip appears because its lower level is unpopulated in this model. These are calculated supplied-model wavelengths, not measured data for a named element. Each vertical axis is dimensionless relative intensity.]
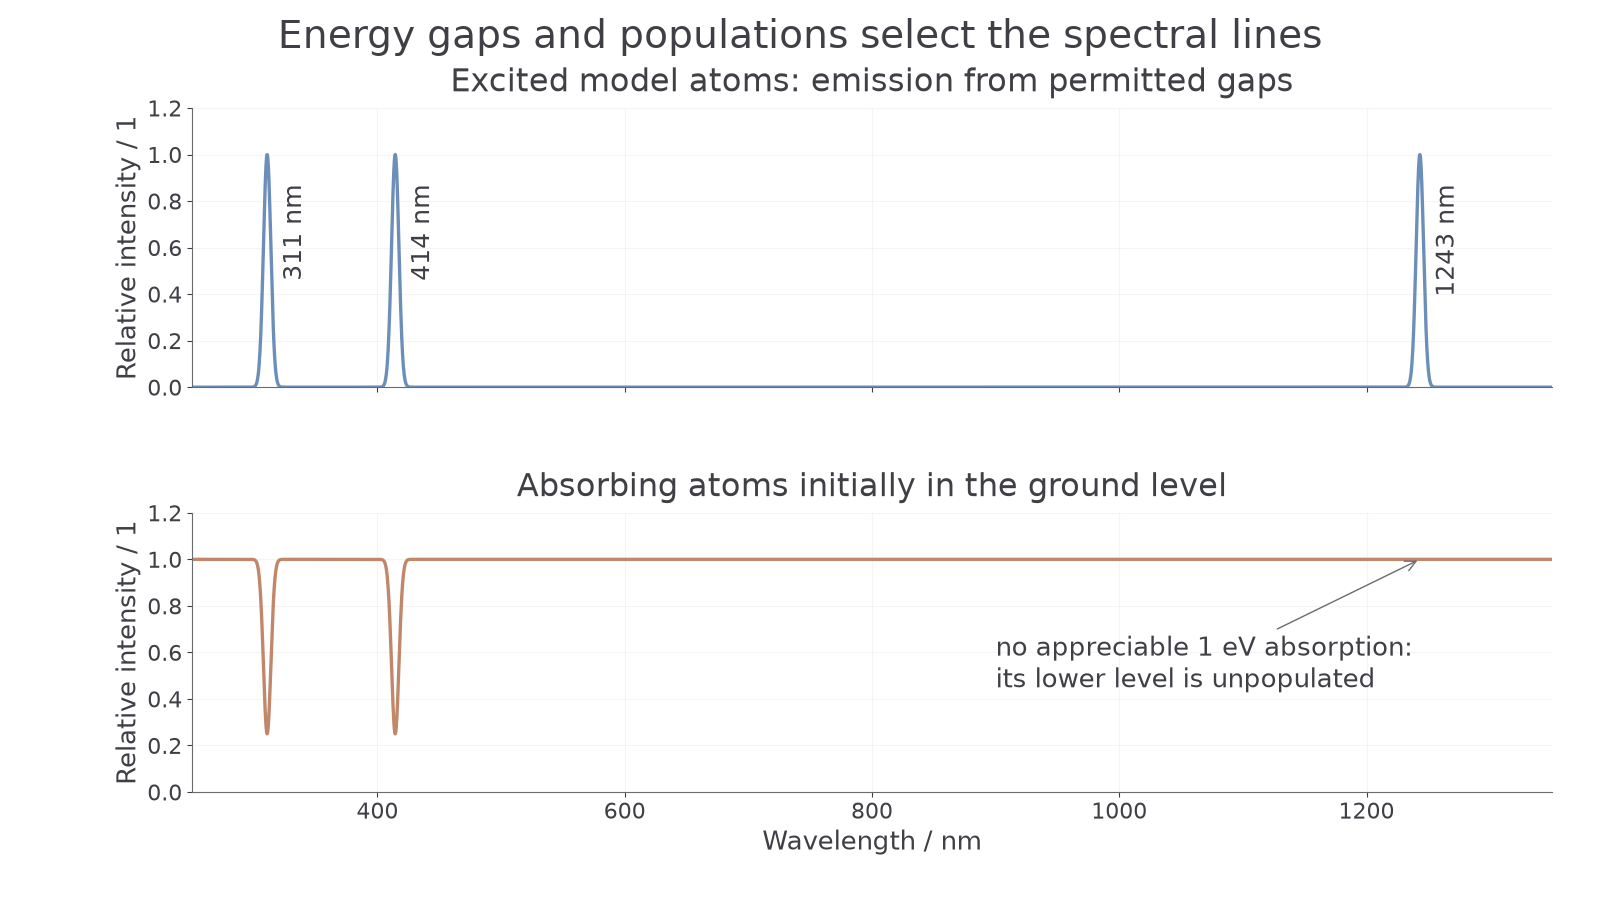
Absorbed energy has not disappeared. The excited atoms can subsequently emit radiation, but that radiation is not all directed along the original beam. Re-emission therefore need not fill in the missing intensity for an observer looking through the gas towards the source.
For a particular pair of levels, the gap is the same in either direction. Absorption and emission therefore involve the same photon wavelength for that transition. However, do not assert that every possible emission line must appear in absorption under any conditions: absorption needs atoms in the relevant lower state, and the populations depend on the gas conditions.
Continue this lesson.
You’re previewing NovaLearn without an account. Create a free account to read the rest.
Create free account