9.9C - Flame photometer data
Use known standards to convert a flame photometer reading into a concentration, and use reference signals to identify metal ions. You will distinguish interpolation from extrapolation and judge how strongly the data support a conclusion.
Reading a calibration curve
For this specification point, treat the flame photometer as a source of results. It may give a reading such as emission intensity, or a pattern of signals for an unknown sample. Your job is to use those results.
Flame photometer data
Flame photometer data is instrument data used to analyse metal ions in solution, usually by comparing readings with calibration data or reference data.
There are two different data questions:
| Question type | Data used | What you determine |
|---|---|---|
| concentration | calibration curve made from known concentrations | concentration of the ion in the unknown dilute solution |
| identity | reference data for known metal ions | which metal ion matches the unknown data |
Do not write long explanations about electrons, flames, filters or the internal parts of the instrument. Pearson's boundary for this point says no knowledge of the instrument or how it works is required. A strong answer stays with the supplied data.
A calibration curve is made using standard solutions. A standard solution has a known concentration. Standards must contain the same ion being measured and be read under the same instrument conditions. Each standard is measured, then the known concentration and the flame photometer reading are plotted.
Calibration curve
A calibration curve is a graph made from known standards that is used to find the concentration of an unknown sample from its measured reading.
For a typical GCSE calibration curve:
- the x-axis is the concentration of the ion
- the y-axis is the flame photometer reading or relative emission intensity
- the standards are the known data points
- the curve or line of best fit is used to read the unknown concentration
Use the curve that is supplied. Do not assume every calibration curve is perfectly straight unless the data or graph shows that it is. If the unknown reading lies between two standards, you can interpolate: read between the known values. If it lies outside the range of the standards, the concentration is less reliable because you are extrapolating beyond the calibration data.
Example calibration data for sodium ions:
| concentration of sodium ions / mg dm^-3 | relative emission intensity |
|---|---|
| 0.0 | 0 |
| 2.0 | 18 |
| 4.0 | 36 |
| 6.0 | 54 |
| 8.0 | 72 |
| 10.0 | 90 |
[DIAGRAM: asset_name: calibration_curve_unknown_concentration - diagram 1; asset_slug: 213_9_9c_flame_photometer_data_diagram1; file: diagram_assets/213_9_9c_flame_photometer_data_diagram1.png; recommended_method: deterministic_drawn; description: Exact monochrome calibration curve for flame photometer data. The x-axis is concentration of sodium ions / mg dm^-3 from 0 to 10. The y-axis is relative emission intensity from 0 to 90. Plot standards at (0,0), (2,18), (4,36), (6,54), (8,72) and (10,90), with a straight best-fit line. Add dashed guide lines from an unknown reading of 45 on the y-axis to the line and down to 5.0 mg dm^-3 on the x-axis. Students should learn that the concentration of an unknown dilute solution is read from the calibration curve. Deterministic drawing is used because the axes, points, line, guide lines and values are exact assessed data.]
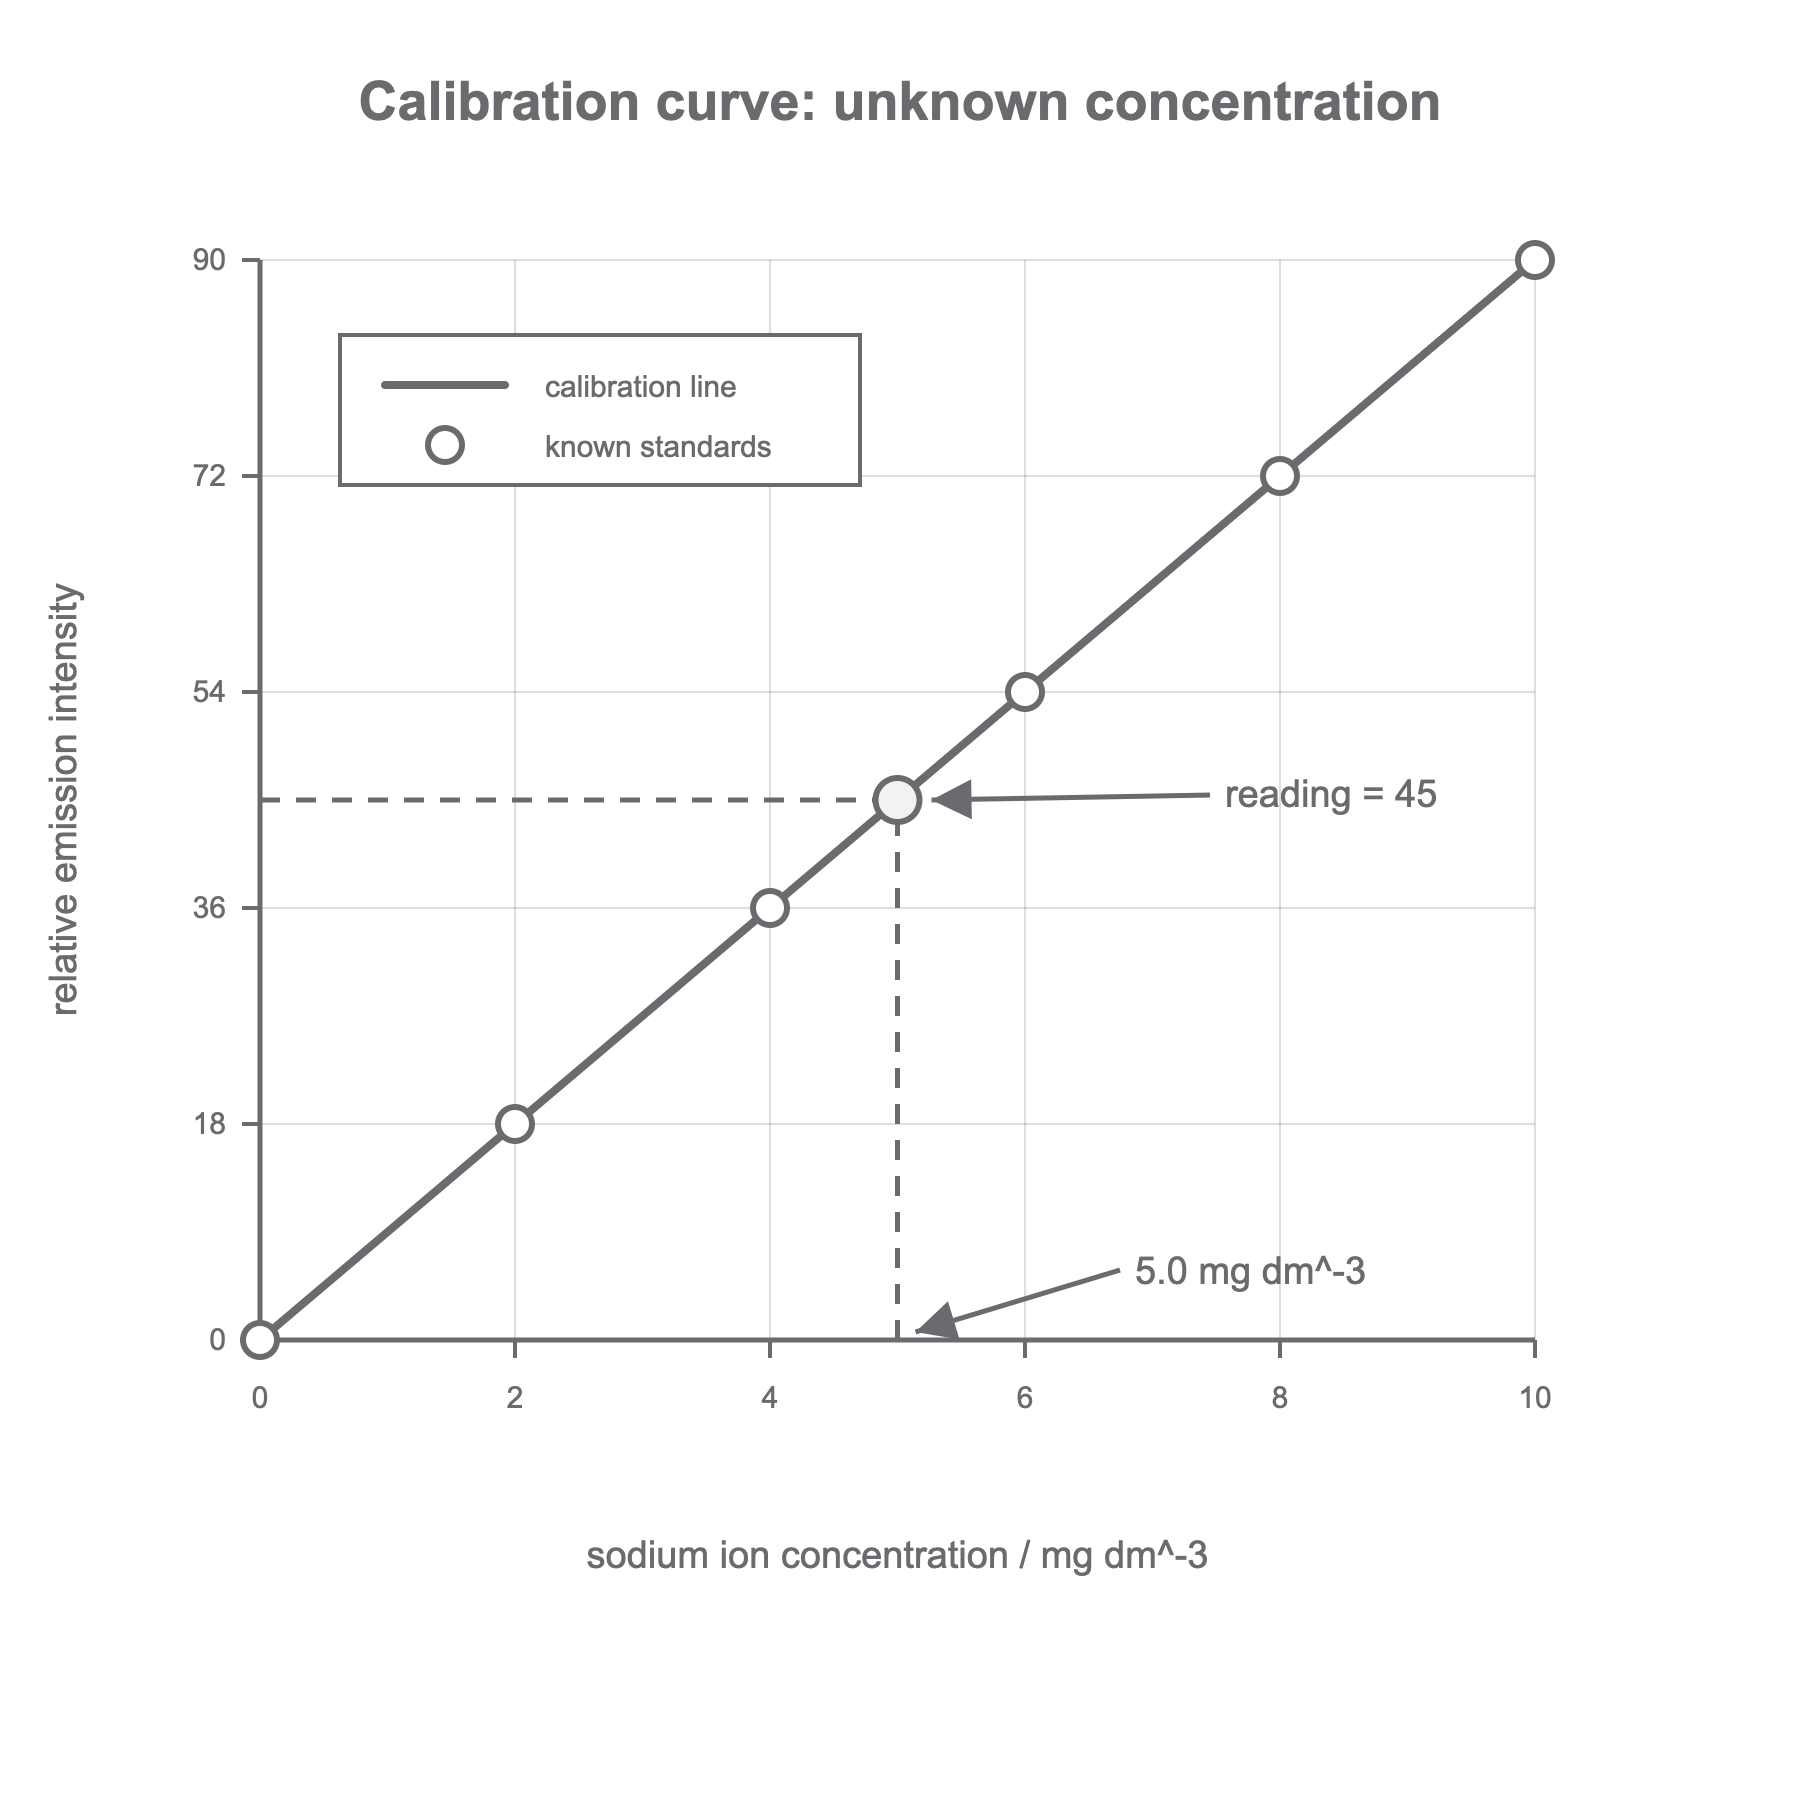
The circle labelled reading = 45 marks the unknown interpolation, not an extra known standard. The unknown sample has a relative emission intensity of 45. On the graph, move across from 45 to the calibration line, then down to the concentration axis. The concentration is .
The same result can be reasoned from the table because 45 is halfway between 36 and 54, so the concentration is halfway between 4.0 and .
Using the calibration range
When you determine an unknown concentration from a flame photometer calibration curve, write the answer as a data route:
- State the unknown reading.
- Use the calibration curve or table to find the matching concentration.
- Include the concentration unit from the axis or table.
- Comment on reliability if the command word asks you to evaluate.
Worked example:
A potassium ion calibration curve has these points:
| concentration of potassium ions / mg dm^-3 | relative emission intensity |
|---|---|
| 0.0 | 0 |
| 1.0 | 12 |
| 2.0 | 24 |
| 3.0 | 36 |
| 4.0 | 48 |
| 5.0 | 60 |
An unknown potassium ion solution gives a reading of 42.
The reading 42 lies halfway between 36 and 48. These readings match 3.0 and , so the concentration is halfway between them:
This is supported by interpolation because 42 is inside the range of the standards. It is not an extrapolated value.
If a reading is above the highest standard, do not invent an exact concentration unless the graph is deliberately extended and the question allows it. For example, a reading of 78 cannot be read reliably from standards that only go up to 60.
Continue this lesson.
You’re previewing NovaLearn without an account. Create a free account to read the rest.
Create free account