7.5 - Interpreting reaction-rate graphs
Reaction-rate graphs show how the amount of a reactant or product changes as time passes. In Edexcel Paper 2, this is a data skill: you may need to read axes, calculate a rate from a gradient, recognise when a reaction has finished, or compare two curves. The same graph habits work for mass, volume and concentration data.
Axes and quantities
A reaction-rate graph usually has time on the horizontal axis. The vertical axis shows a measured quantity related to a reactant or product.
| Horizontal axis | Vertical axis could be | Typical unit |
|---|---|---|
| time | volume of gas produced | |
| time | mass of a reactant remaining | g |
| time | mass of product formed | g |
| time | concentration of a reactant or product | mol dm-3 or g dm-3 |
Always read the axis label before deciding what the curve means. A product graph often rises because more product is formed. A reactant graph often falls because reactant is used up. A mass graph can rise or fall depending on what mass is being measured. For example, the mass of a product may increase, but the mass of an open reaction flask may decrease if a gas escapes.
Rate of reaction
Rate of reaction is the change in amount of reactant or product per unit time.
For this lesson, "amount" means the measured graph quantity, such as volume, mass or concentration. A graph of volume of gas against time can therefore give a rate in . A graph of concentration against time can give a rate in mol dm-3 s-1 if concentration is measured in mol dm-3 and time is measured in seconds.
Gradient as rate
The gradient of an amount-against-time graph tells you the rate of change of that amount. The gradient is the change in the vertical-axis quantity divided by the change in time.
Gradient and rate
For a straight section of graph, use two points on that section. For a curve, a tangent can be drawn at the time you are interested in, and the gradient of the tangent gives the rate at that time. Choose two well-separated points on the tangent, not on the curve, when calculating its gradient.
[DIAGRAM: asset_name: product_graph_gradient: Product graph showing gradient, tangent and plateau - diagram 1; asset_slug: 167_7_5_interpreting_reaction_rate_graphs_diagram1; file: 167_7_5_interpreting_reaction_rate_graphs_diagram1_corrected.png; recommended_method: deterministic_drawn; description: Exact monochrome graph of volume of gas produced against time. The x-axis is labelled time / s and the y-axis is labelled volume of gas / cm3. A single curve rises steeply from 0, becomes shallower, then plateaus at about 80 cm3. The graph includes a tangent at 40 s, a gradient triangle labelled change in volume and change in time, and labels for faster initial rate, slower later rate and plateau: rate = 0. Assessed graph visual; deterministic drawing is used because axes, curve shape, tangent and gradient labels must be exact.]
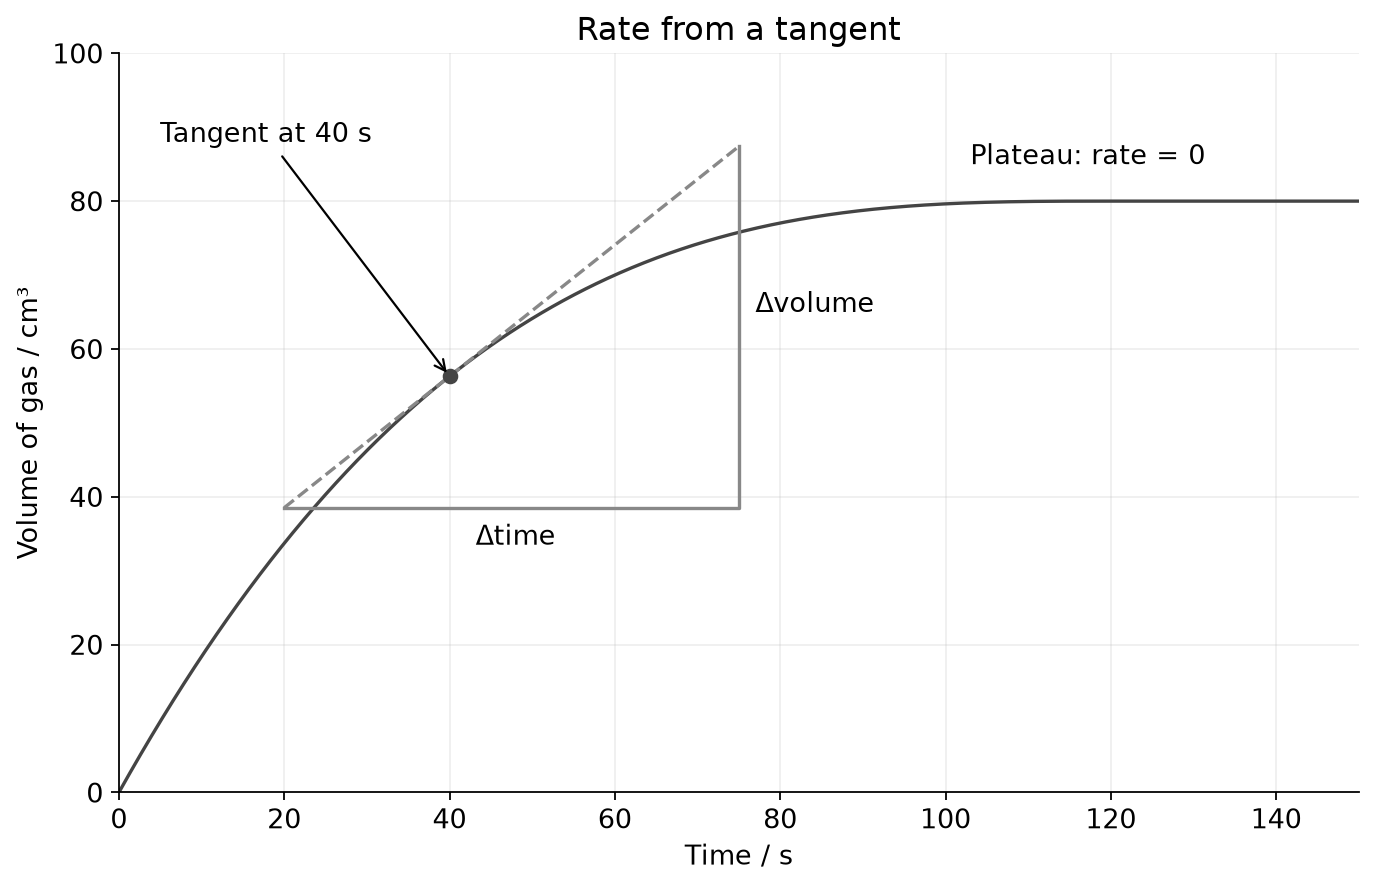
Worked example: a reaction produces of gas in the first 30 s.
That is a mean rate for the first 30 s. It does not mean the rate was exactly at every moment during those 30 s; the curve may be steeper at the start and less steep later.
For a falling reactant graph, the mathematical gradient is negative because the y-value decreases. In chemistry, the rate of using up the reactant is usually reported as a positive value by using the size of the decrease.
Example: the concentration of a reactant decreases from 0.80 mol dm-3 to 0.50 mol dm-3 in 60 s.
The next check uses the same gradient idea for a reactant graph, where the reported rate uses the positive size of the decrease.
Steepness and plateau
The shape of a reaction-rate graph is part of the answer. Use the words steeper, shallower, horizontal, constant, plateau and gradient carefully.
For a product graph:
| Graph feature | Meaning |
|---|---|
| steep rising section | product is being formed quickly |
| shallower rising section | product is still forming, but more slowly |
| horizontal plateau | product amount is no longer increasing; rate is zero |
| higher final plateau | more product has formed overall |
For a reactant graph:
Continue this lesson.
You’re previewing NovaLearn without an account. Create a free account to read the rest.
Create free account