4.12 - Evaluating life-cycle assessment data
Use life-cycle assessment data to compare products fairly, calculate comparable totals and make an evidence-based decision. You will distinguish a result for one environmental measure from a conclusion about the whole product.
Comparing the same service
In this topic, an LCA compares the environmental impact of a product across its life cycle. The key stages from the previous specification point are obtaining raw materials, manufacturing the product, using the product, and disposing of it when it is no longer useful.
Life Cycle Assessment
A life cycle assessment is a way of considering the environmental impact of a product over its lifetime, from obtaining raw materials to disposal.
For 4.12, the assessed skill is evaluation. To evaluate LCA data, you review the information, bring it together, and reach a judgement that is supported by evidence. That means naming the data that matter, comparing values with units, and noticing any weaknesses or assumptions in the data.
A weak answer is:
Product B is better because it is better for the environment.
A stronger answer is:
Product B produces less solid waste, 0.3 kg compared with 1.2 kg, so it may be better if reducing waste is the priority. However, Product A uses less energy, so the conclusion depends on which impact is considered most important.
Before choosing a product, read the setup of the data. LCA comparisons are only fair if they compare the same function. For example, comparing one paper cup with one ceramic mug is usually not fair if the ceramic mug is designed to be reused many times.
Functional Unit
The functional unit is the fair basis for comparison, such as 50 hot drinks served or 100 shopping trips carried.
Then check the units. Energy in MJ, water in L, solid waste in kg, and CO2-equivalent emissions in kg are different measures. CO2-equivalent expresses the warming effect of greenhouse-gas emissions as the mass of carbon dioxide with the same effect. You can compare energy with energy, but you cannot add energy, water and waste together unless the question gives a valid scoring method.
The basic numerical step is to total one metric across the life-cycle stages.
Total for one LCA metric
Use this relationship only if the stages cover the stated boundary without overlaps or omissions. Transport must be included in a stage or added separately. Missing stages must not be treated as zero. For a partial dataset, call the sum the total for the included stages, not a whole-life total.
Use this relationship for one unit at a time. For example, add energy values in MJ to find total energy, but do not add MJ to L or kg.
Calculating comparable totals
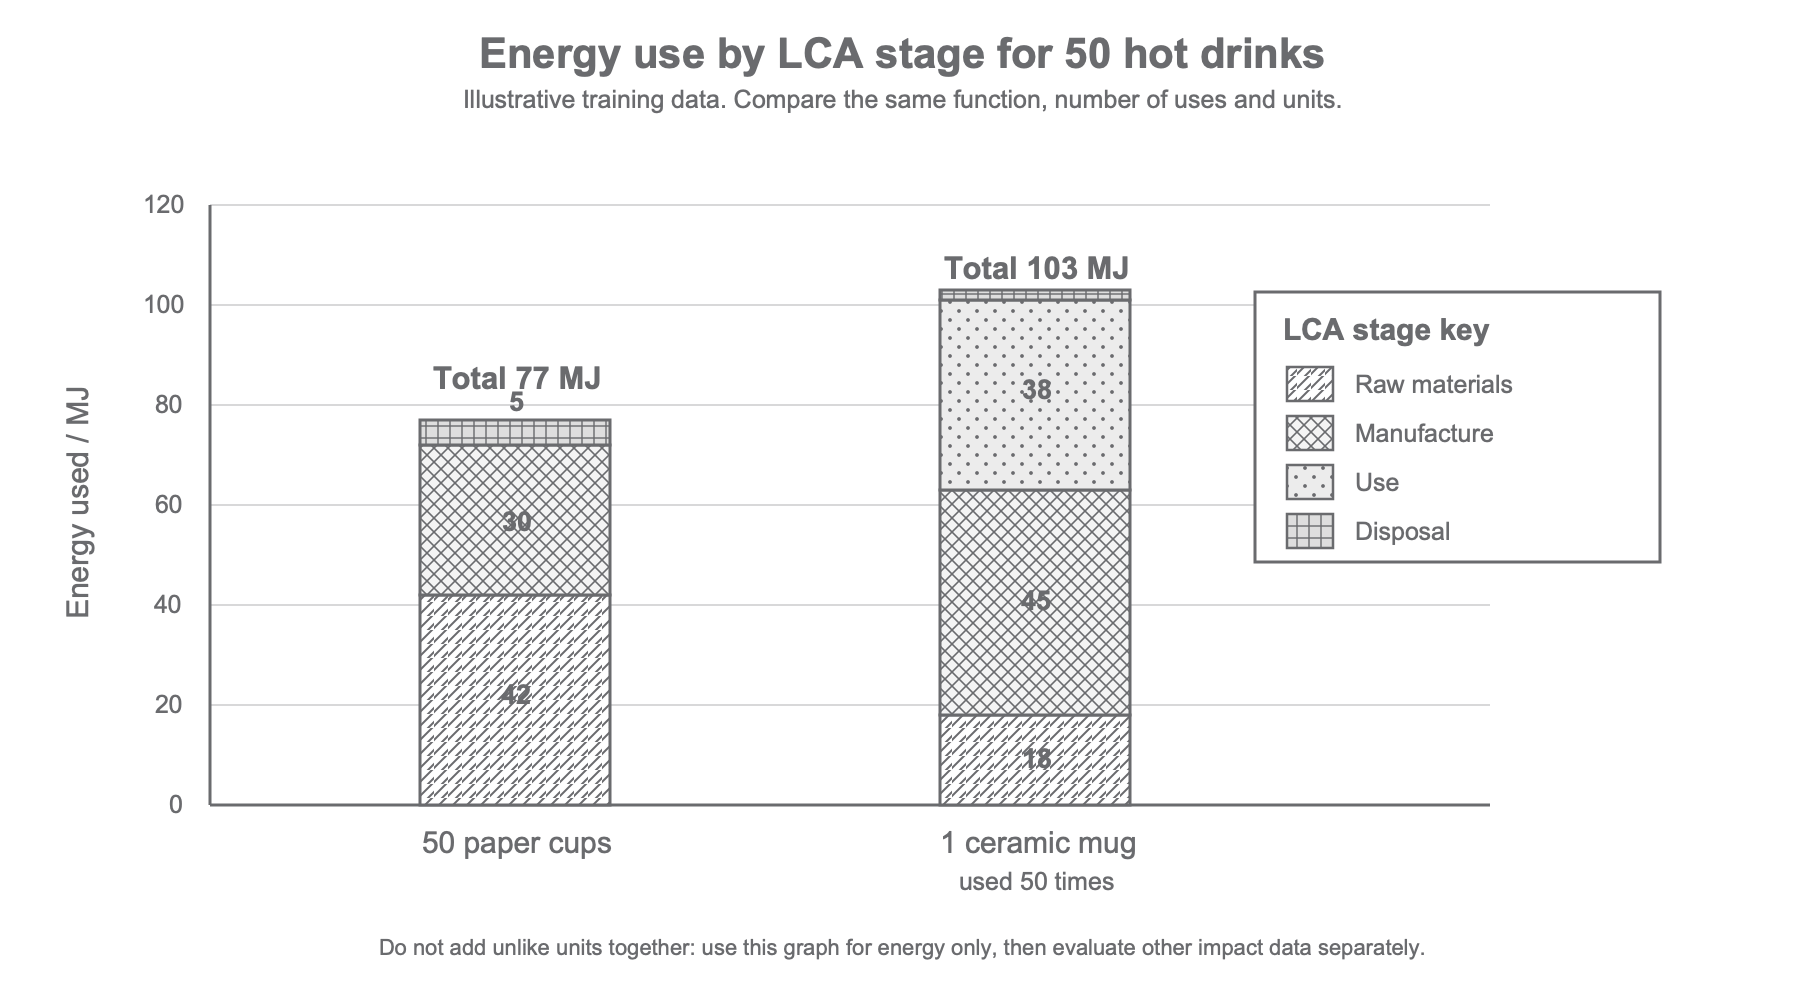
The table below uses simplified training data. It is not a claim about all cups or all mugs; it is a dataset for practising LCA evaluation.
Functional unit: 50 hot drinks of the same volume served. Illustrative boundary: obtaining materials, manufacture, transport allocated to the relevant stage, cup/mug use and end-of-life treatment. Heating the drink is identical for both options and excluded. Mug washing is included in use; the paper cups need no washing. Water, solid waste and emissions rows give totals across this boundary. The mug is assumed to last exactly 50 uses, and all its production and disposal impacts are assigned to those uses.
| Impact for 50 hot drinks | 50 paper cups | 1 ceramic mug used 50 times |
|---|---|---|
| energy: raw materials / MJ | 42 | 18 |
| energy: manufacture / MJ | 30 | 45 |
| energy: use / MJ | 0 | 38 |
| energy: disposal / MJ | 5 | 2 |
| water used / L | 95 | 150 |
| solid waste / kg | 1.2 | 0.3 |
| CO2-equivalent emissions / kg | 5.1 | 4.2 |
[DIAGRAM: asset_name: lca_energy_stage_graph: LCA energy use by stage for 50 hot drinks - diagram 1; asset_slug: 114_4_12_data_from_a_life_cycle_assessment_of_a_product_diagram1; file: diagram_assets/114_4_12_data_from_a_life_cycle_assessment_of_a_product_diagram1.png; recommended_method: deterministic_drawn; description: Exact monochrome stacked bar chart for the illustrative LCA data. It compares energy use in MJ for 50 paper cups and one ceramic mug used 50 times. Stage values are raw materials 42 vs 18 MJ, manufacture 30 vs 45 MJ, use 0 vs 38 MJ, and disposal 5 vs 2 MJ, giving totals of 77 MJ and 103 MJ. This is an assessed data visual, so deterministic drawing is required.]
Worked example:
Calculate the total energy used for each option.
Continue this lesson.
You’re previewing NovaLearn without an account. Create a free account to read the rest.
Create free account