8.25 - Evidence linking human activity to climate change
Use climate records to compare fossil-fuel use, carbon dioxide and temperature. Evaluate what the trends show, how measurement uncertainty is handled, and why a causal explanation needs more than matching lines.
Comparing the records
A positive correlation means that two quantities tend to increase together. For climate evidence, compare fossil-fuel consumption, atmospheric carbon dioxide concentration and global temperature over the same period.
| Quantity | Unit | Meaning |
|---|---|---|
| Fossil-fuel consumption | TWh per year | Energy from coal, oil and gas consumed in a year |
| Atmospheric CO₂ | ppm | Parts of carbon dioxide per million parts of dry air |
| Temperature anomaly | °C | Difference from the average for a stated reference period |
A temperature anomaly is a difference, not the absolute temperature. An anomaly of +1.28°C means 1.28°C warmer than the chosen reference average. Comparisons need the same reference period.
[DIAGRAM: asset_name: Three evidence trends - diagram 1; asset_slug: 203_8_25_evidence_for_human_activity_causing_climate_change_diagram1; file: diagram_assets/203_8_25_evidence_for_human_activity_causing_climate_change_diagram1.png; recommended_method: deterministic_drawn; description: Deterministic monochrome stacked line graphs for Edexcel 1CH0 8.25. The asset shows exact public data for 1965-2024 with separate y-axes: world fossil-fuel primary energy consumption from Energy Institute/Our World in Data in TWh, annual mean atmospheric CO2 at Mauna Loa from NOAA in ppm, and NASA GISTEMP global temperature anomaly in degrees C relative to 1951-1980. Exact endpoint labels: fossil fuels 40,493 TWh to 142,421 TWh; CO2 320.04 ppm to 424.61 ppm; temperature anomaly -0.11 degrees C to 1.28 degrees C. It teaches positive correlation while warning that evaluation must also consider measurement location and historical accuracy. Assessed/exact graph, so it is deterministic, white background, #6A6B6E linework/text, no colour coding.]
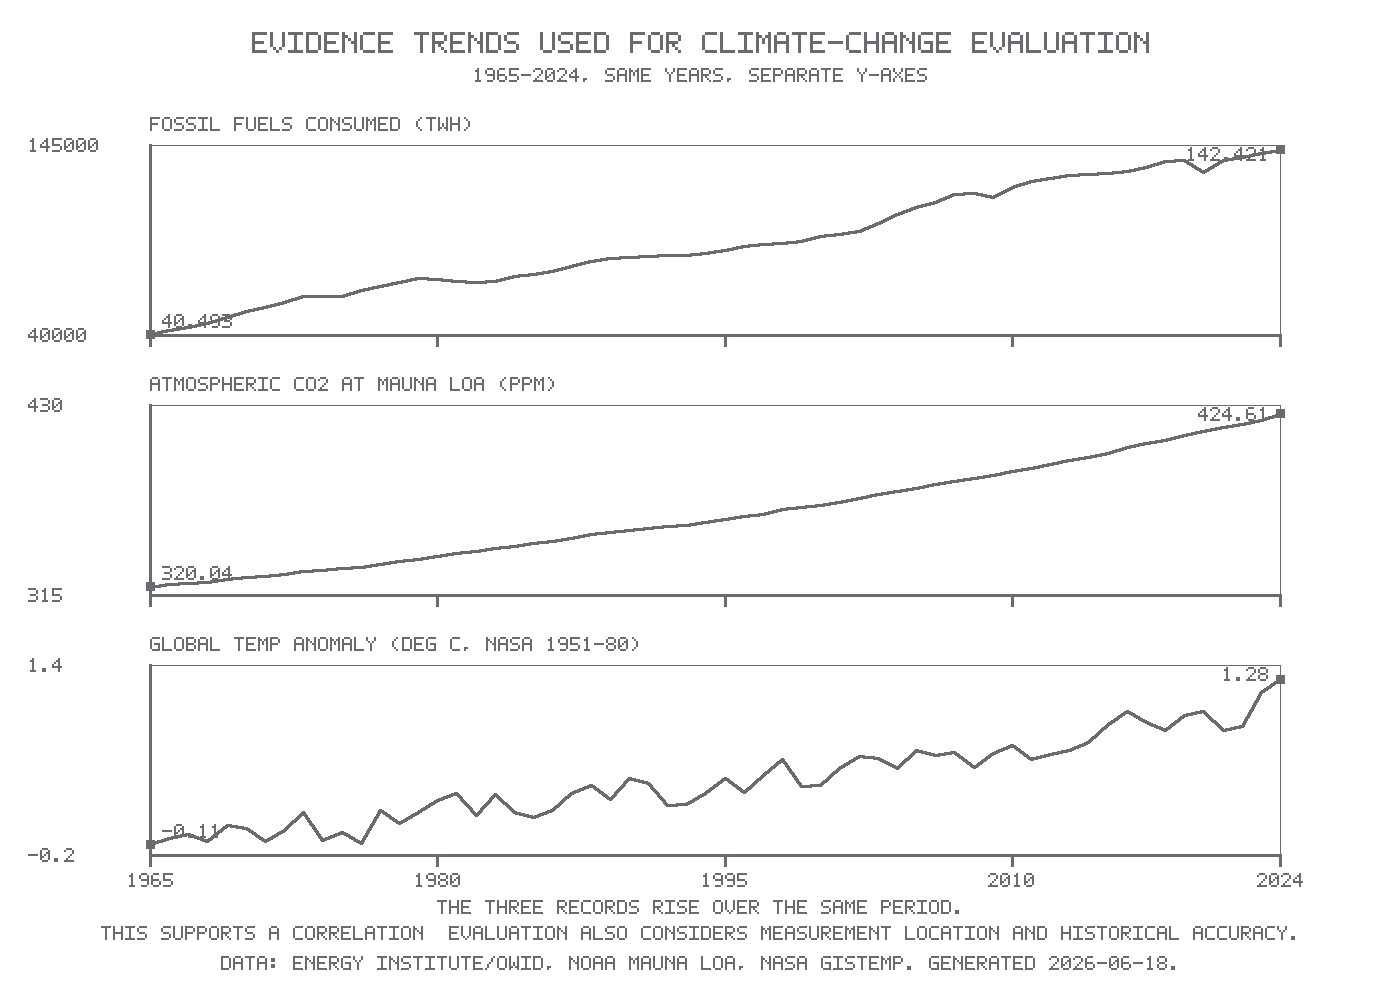
The records show overall increases from 1965 to 2024. Temperature fluctuates more from year to year, but its long-term trend rises. Different units and vertical scales mean that line steepness cannot be compared directly across panels. One cooler year does not overturn a multi-decade warming trend.
The chart is a historical dataset snapshot, not a claim to show the latest year. Its 2024 value of +1.28°C follows NASA’s published 2024 result; later dataset revisions may change an annual value slightly without changing the conclusion. Its CO₂ record is from Mauna Loa; its temperature anomaly is global and uses the 1951–1980 reference period. Source data are from NOAA, NASA GISTEMP and the Energy Institute.
From correlation to a cause
Matching trends alone do not establish that one variable caused the other: another factor might affect both. A mechanism and additional independent evidence are needed.
Burning fossil fuels releases carbon dioxide. CO₂ absorbs infrared radiation emitted by Earth and emits infrared in all directions. Increasing its concentration changes the rate at which energy escapes to space, enhancing the greenhouse effect and causing warming. This mechanism explains why the correlation is relevant.
Continue this lesson.
You’re previewing NovaLearn without an account. Create a free account to read the rest.
Create free account