2.10 - Reading chromatograms and calculating Rf
You will use spot patterns to investigate purity and identify possible components, then calculate Rf values from measurements made from the baseline.
Reading spots and judging purity
A paper chromatogram is the paper after a chromatography run. The original sample positions are on the baseline. The solvent front shows how far the solvent travelled before the paper was removed and dried.
The separated substances appear as spots. A spot higher up the paper has travelled further from the baseline. In an Edexcel interpretation question, the position and number of spots matter more than the colour of the spots.
Solvent front
The solvent front is the line marking the furthest distance travelled by the solvent from the baseline.
For Rf calculations, measure:
- the distance from the baseline to the centre of the spot
- the distance from the baseline to the solvent front
The centre of the spot is used because spots often spread out slightly as they move.
A pure soluble substance should give one spot when it is detectable. One spot is evidence of purity, but does not prove it: two substances may overlap, or one may be undetectable in the chosen conditions.
A mixture can give more than one spot. Different components of the mixture travel different distances, so they separate into different positions on the paper.
| Chromatogram result | Interpretation |
|---|---|
| One spot from the sample | one visible component; consistent with purity |
| Two or more spots from the sample | the sample is impure or is a mixture |
Be precise: a sample with two spots is not "more pure" because the spots are neat. More than one spot means more than one substance has been separated.
Comparing unknowns with known substances
One way to identify substances is to run known substances on the same chromatogram as the unknown. If a spot in the unknown is at the same height as a spot from a known substance, the two substances may be the same. This comparison is strongest when the samples were run on the same paper with the same solvent.
[DIAGRAM: asset_name: chromatogram_knowns_and_unknowns - diagram 1; asset_slug: 069_2_10_interpreting_paper_chromatograms_and_rf_values_diagram1; file: 069_2_10_interpreting_paper_chromatograms_and_rf_values_diagram1.png; recommended_method: deterministic_drawn; description: Exact monochrome chromatogram and data table for an original example. Solvent front is 80 mm from the baseline. Known A has one spot at 20 mm, Rf 0.25. Known B has one spot at 48 mm, Rf 0.60. Known C has one spot at 68 mm, Rf 0.85. Unknown X has two spots at 20 mm and 68 mm, so it matches A and C and is impure. Unknown Y has one spot at 48 mm, so it matches B. Deterministic drawing is required because the spot positions, labels, table values and Rf values are assessed interpretation content. Nearby prose gives the same data for accessibility.]
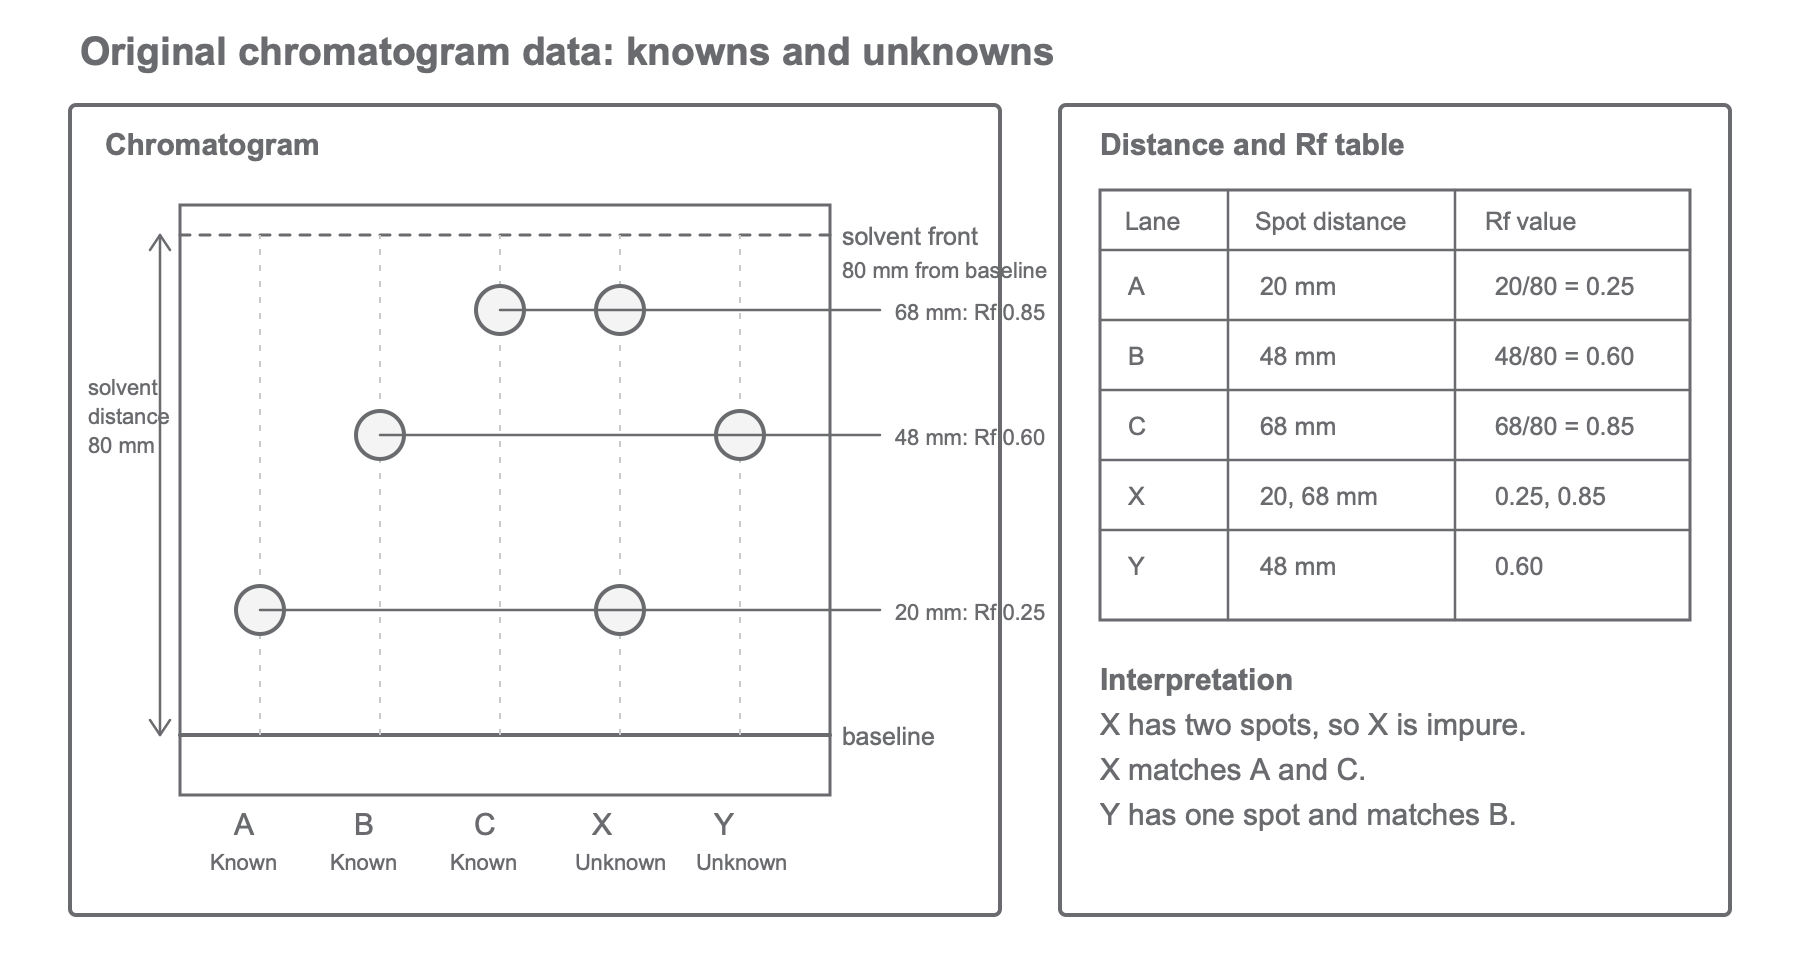
In the example, the solvent front is 80 mm from the baseline.
| Lane | Spot distances from baseline | Interpretation |
|---|---|---|
| Known A | 20 mm | one substance |
| Known B | 48 mm | one substance |
| Known C | 68 mm | one substance |
| Unknown X | 20 mm and 68 mm | matches A and C; mixture |
| Unknown Y | 48 mm | matches B; one visible substance |
Continue this lesson.
You’re previewing NovaLearn without an account. Create a free account to read the rest.
Create free account