7.04c - Areas under graphs
Can an object travel twenty metres and finish where it started? Learn how areas under velocity-time graphs record motion, and why signed area and total distance can differ. Use rectangles, triangles and trapezia for straight segments, estimate curved areas, and work out what an area means from its units.
Areas under straight-line segments
At a constant speed of for seconds, an object travels metres. On a speed-time graph this is the area of a rectangle of height six and width five. The graph's area is measured in axis-value products, not square centimetres on the paper.
For a speed increasing uniformly from zero, the region is a triangle. Its area, half base times height, is also average speed times duration: times . A straight segment between two nonzero speeds gives a trapezium, with the two vertical speeds as its parallel sides.
Area and motion
For a nonnegative speed-time graph,
For a straight segment over duration , starting at speed and ending at speed ,
The trapezium area formula is in the 2027 formula sheet. Its use to interpret a motion graph is not stated there: learn the connection.
Split a piecewise straight graph at each change of slope. Find every shape's width by subtracting times, then add the areas. Do not multiply the maximum speed by the whole duration unless that speed is maintained throughout.
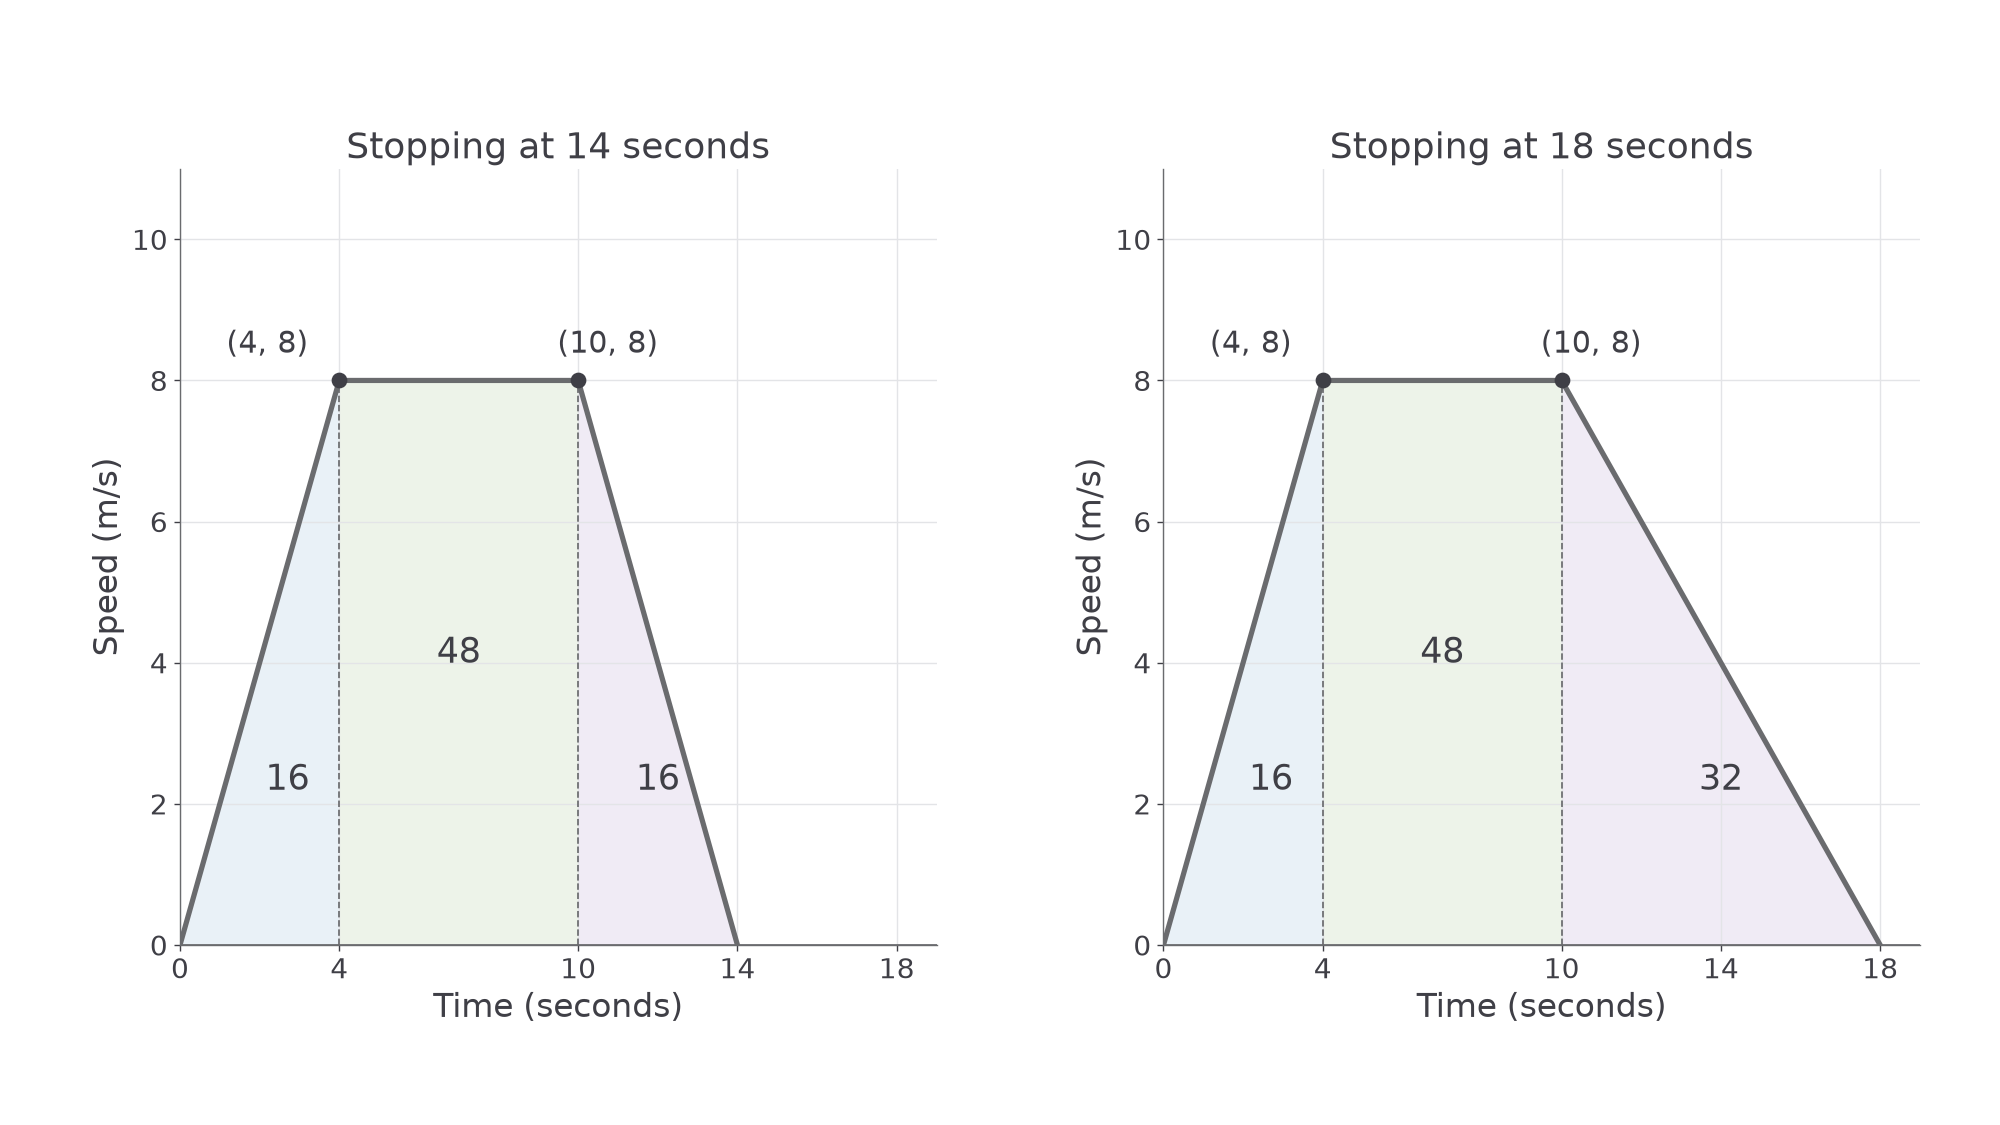
[DIAGRAM: asset_name: Areas for two motion profiles; asset_slug: polygon-motion-areas; caption: Extending only the final slowing-down stage adds triangular area.; description: Two speed-time graphs have vertices zero zero, four eight, ten eight and respectively fourteen zero or eighteen zero. Each area is split into an initial triangle, middle rectangle and final triangle.]
Worked example 1: three straight stages
Question. A speed-time graph joins , , and , with seconds and metres per second. Find the distance travelled.
Plan. Add the two triangle areas and the central rectangle area.
Answer. metres.
Check. The whole region is a trapezium with parallel horizontal sides and , separated by . Its area is .
Change only the final stopping time from fourteen to eighteen seconds. The first two stages stay unchanged.
Worked example 2: a longer final stage
Question. The new speed-time graph joins , , and . Find the distance travelled.
Plan. Retain the first two areas and recalculate the final triangle's width.
Answer. metres.
Check. The extra four seconds add metres to the triangular area: . The average speed is , less than the maximum of eight.
When all speeds are nonnegative, the area is a distance. The same calculation on a velocity-time graph gives a signed change of position; the distinction matters once the graph goes below the axis.
Watch out
The middle rectangle in the first example has width , not ten. Coordinates are times at endpoints; area needs elapsed time between them.
Use the area method on a fresh profile.
Estimating curved areas
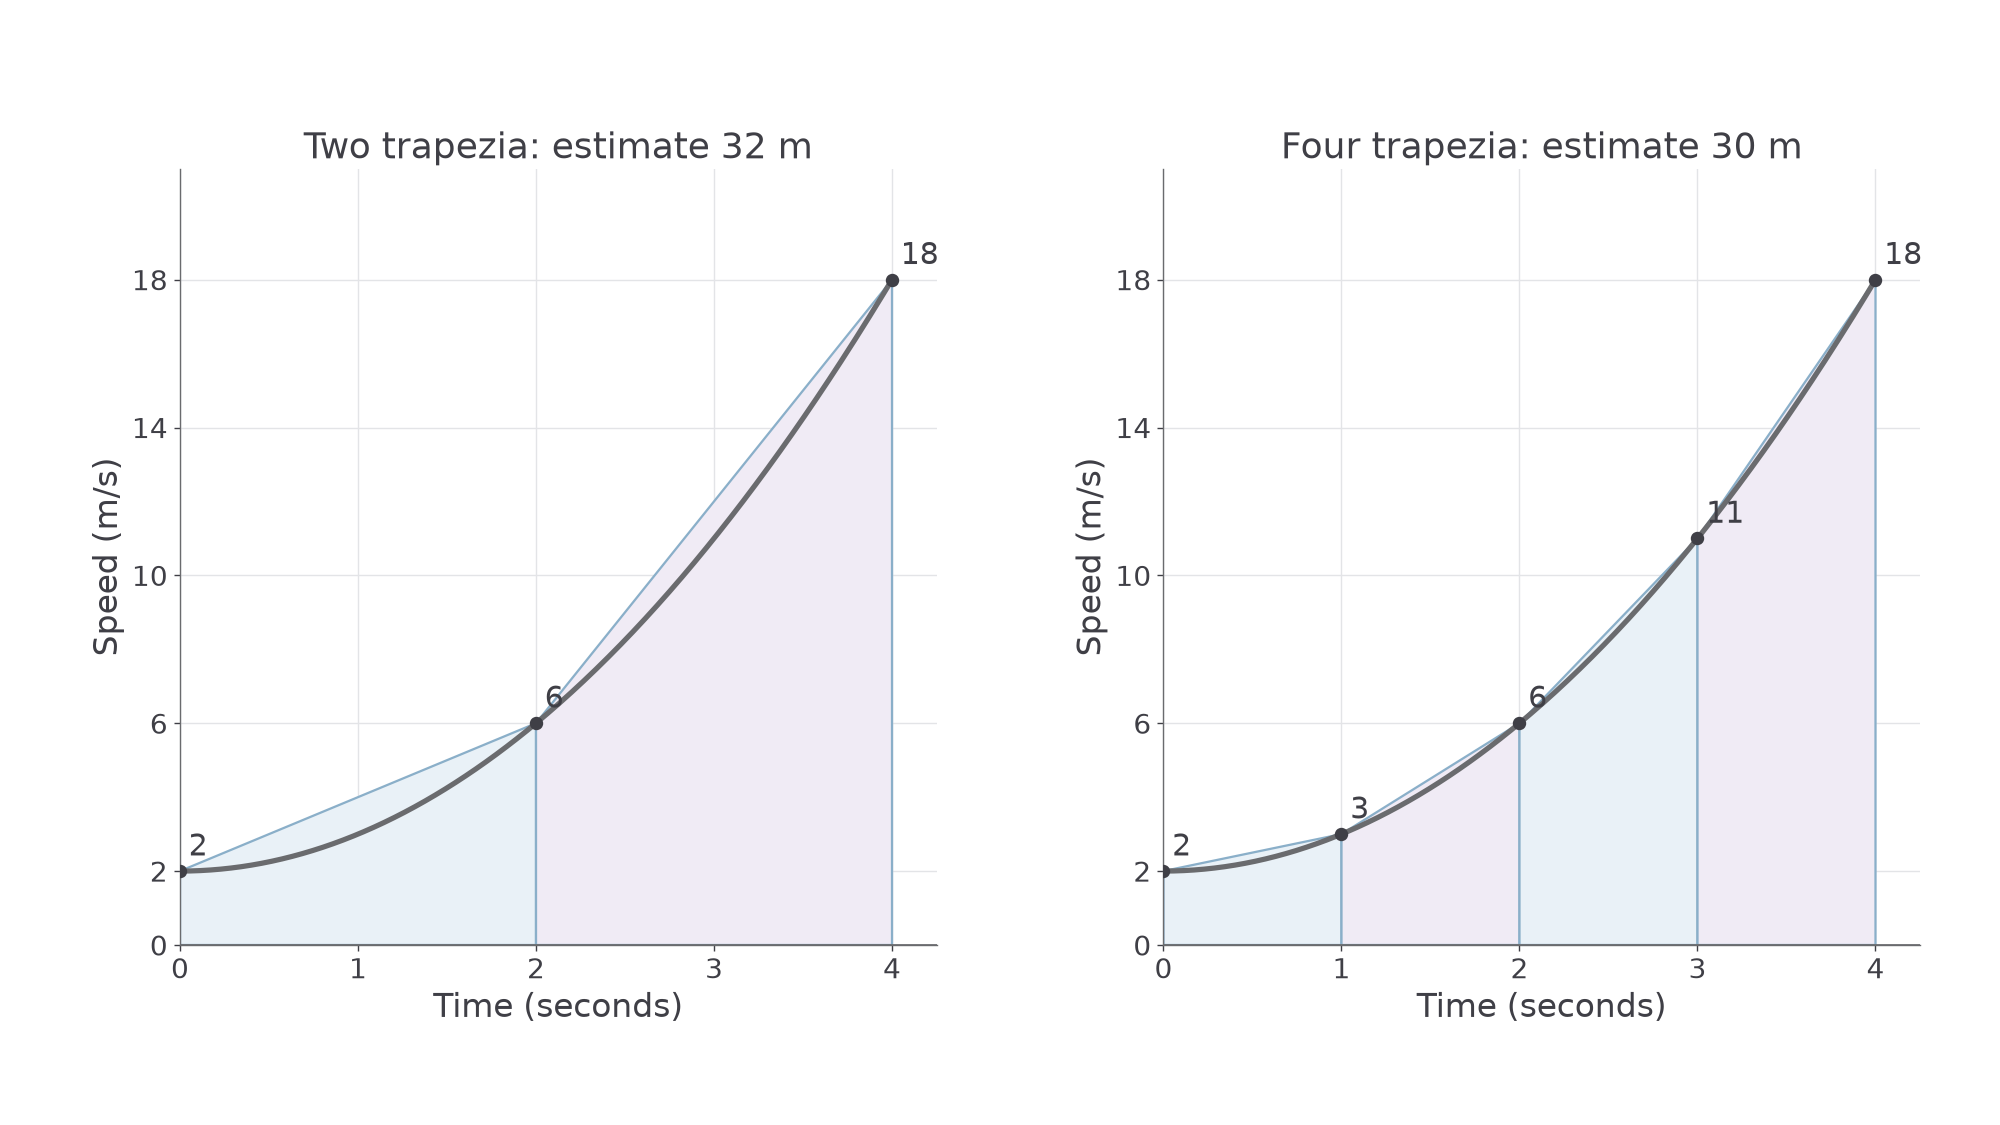
A curved speed graph cannot usually be split into a few exact triangles. Replace short sections by straight chords and calculate the resulting trapezia. The sum estimates the area under the curve.
Use the actual horizontal widths, which need not be equal. For adjacent readings and , the strip estimate is . Shared internal readings are used twice, once for each neighbouring strip; they are not extra measurements.
The graph tells you about the direction of error. If every chord lies above a section of curve, those trapezia overestimate its area. If they lie below, they underestimate it. For a curve changing its bend, inspect each strip; a blanket claim about every trapezium estimate is unsafe.
[DIAGRAM: asset_name: Refining a curved-area estimate; asset_slug: curved-area-estimates; caption: Narrower trapezia follow this upward-bending curve more closely.; description: Two panels show the speed curve v equals two plus t squared from zero to four seconds. The first uses two trapezia of width two, and the second four trapezia of width one. Both chord sets lie above the curve between readings.]
Worked example 3: two trapezia
Question. A speed graph has readings , and . Estimate the distance from zero to four seconds using two trapezia.
Plan. Each strip is two seconds wide. Average its endpoint speeds and multiply by two.
Answer. Approximately metres.
Check. The shortcut weights the outer readings once and the shared reading twice. On the displayed upward-bending curve, both chords are above the curve, so this is an overestimate.
Continue this lesson.
You’re previewing NovaLearn without an account. Create a free account to read the rest.
Create free account