7.01b, 7.01c, 7.02a - Straight-line graphs
How can five calculated points describe infinitely many answers? Learn to plot and sketch straight lines, distinguish horizontal from vertical lines, and read what a gradient and an intercept tell you.
Plotting from a table
If a machine follows the rule , can you show every possible input and output without writing an endless table?
Start by substituting a few inputs. Each pair gives one point: move along the horizontal -axis first, then up or down parallel to the vertical -axis. Label both axes and choose a scale with equal numerical steps at equal distances along each axis. The two axes may use different scales.
Graph of an equation
The graph of an equation is the set of points whose coordinates satisfy it. A linear equation in and gives a straight line. A table supplies sample points on that line.
A plot uses calculated coordinates on a scale. For a straight line, two distinct correct points determine its position; a third is a useful error check. If a range is specified, draw the line across that range. Otherwise show its continuation, rather than treating the table's first and last points as mathematical endpoints.
Worked example 1: positive changes
Question. Complete a table for at , then plot the graph for .
Plan. Substitute each input, plot the five coordinate pairs, and use a ruler to join them.
Answer. Plot , then draw the straight line through them over the requested range.
Check. Each increase of in increases by . All five points follow that same change, so they line up.
Change only the sign of the coefficient of . The graph will now fall as you move right.
Worked example 2: negative changes
Question. Complete and plot the corresponding table for over the same range.
Plan. Keep the inputs and calculate each new output before drawing the line.
Answer. Plot and join with a ruled line.
Check. At , the equation gives . The drawn line crosses the -axis halfway between and , consistent with this extra point.
[DIAGRAM: asset_name: Tables produce rising and falling lines; asset_slug: linear-tables; caption: Changing the coefficient from positive two to negative two reverses the direction.; description: Two scaled coordinate grids show y equals two x plus one and y equals negative two x plus one for x from negative two to two. All five calculated points are marked on each straight line.]
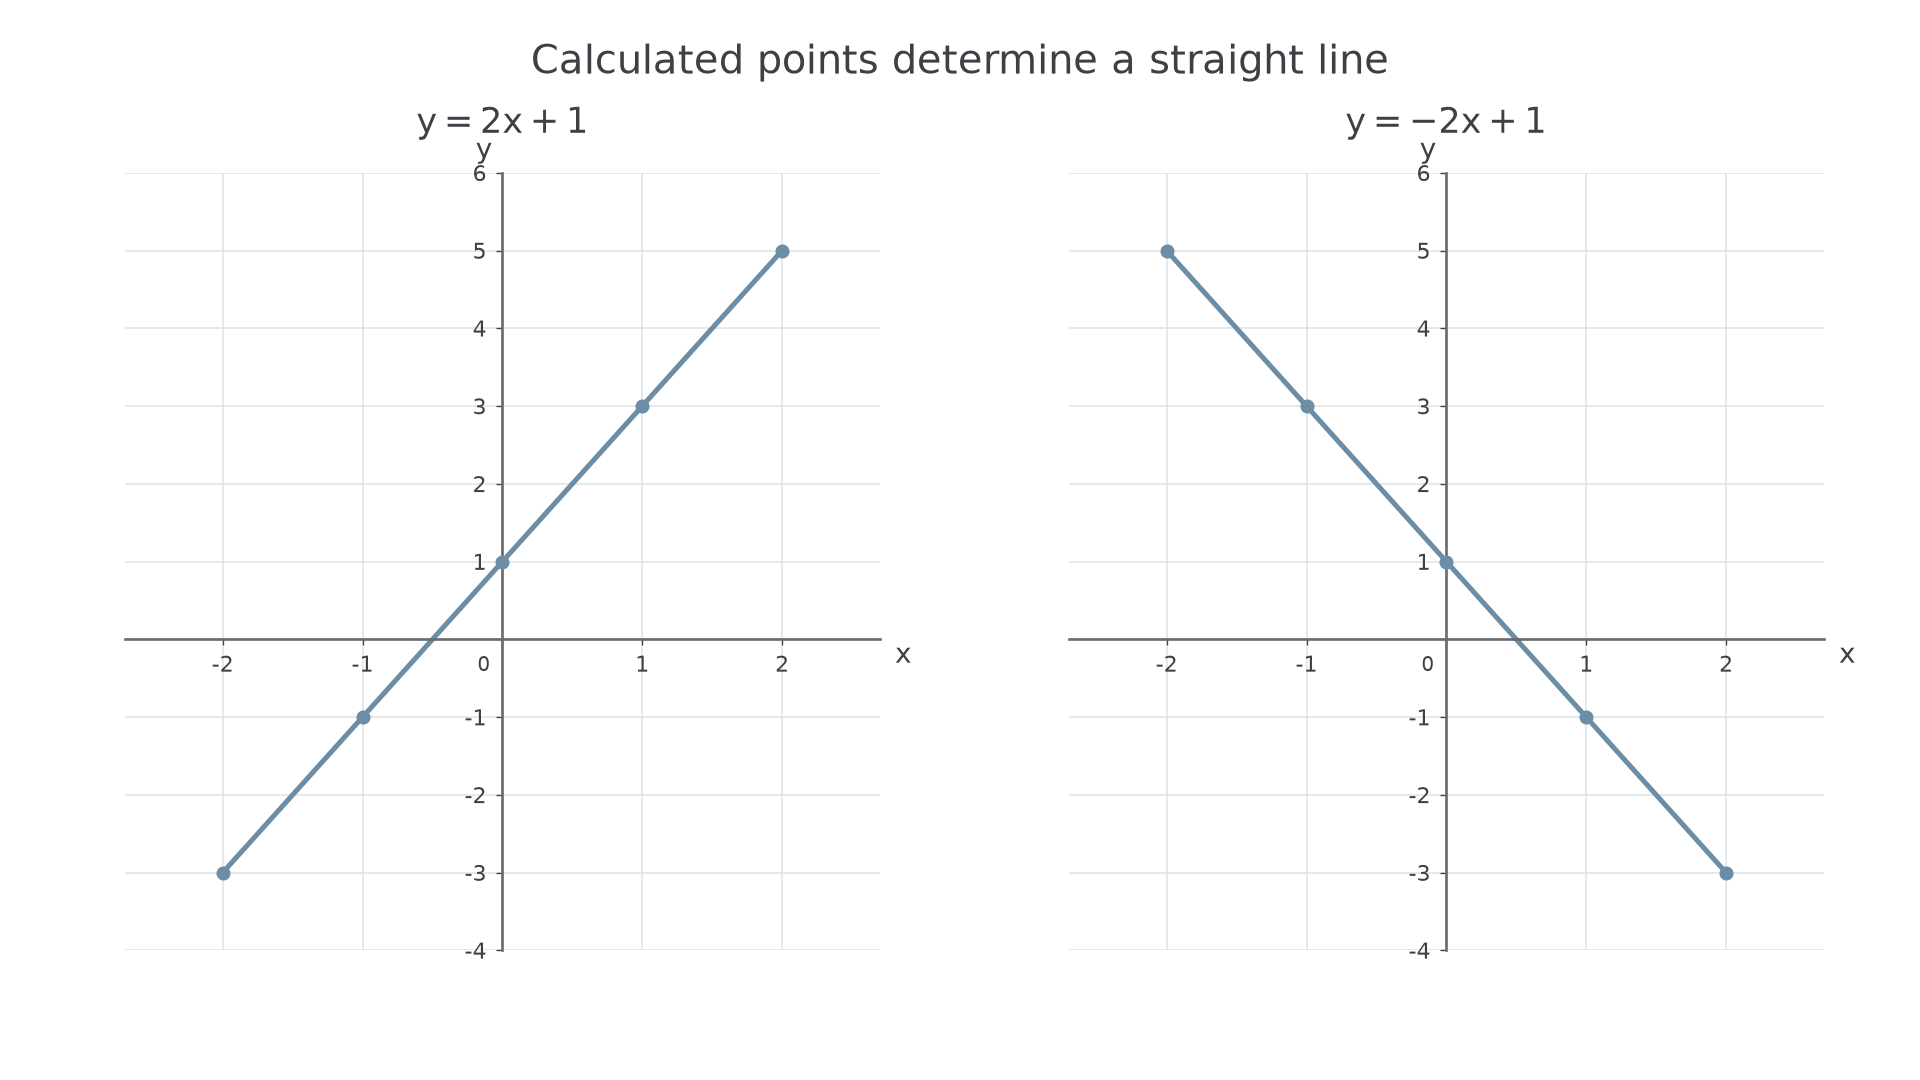
The infinite set of solutions has a simple picture: a constant change in output for each fixed change in input produces a straight line.
Horizontal and vertical lines
An equation can fix one coordinate while allowing the other to vary freely.
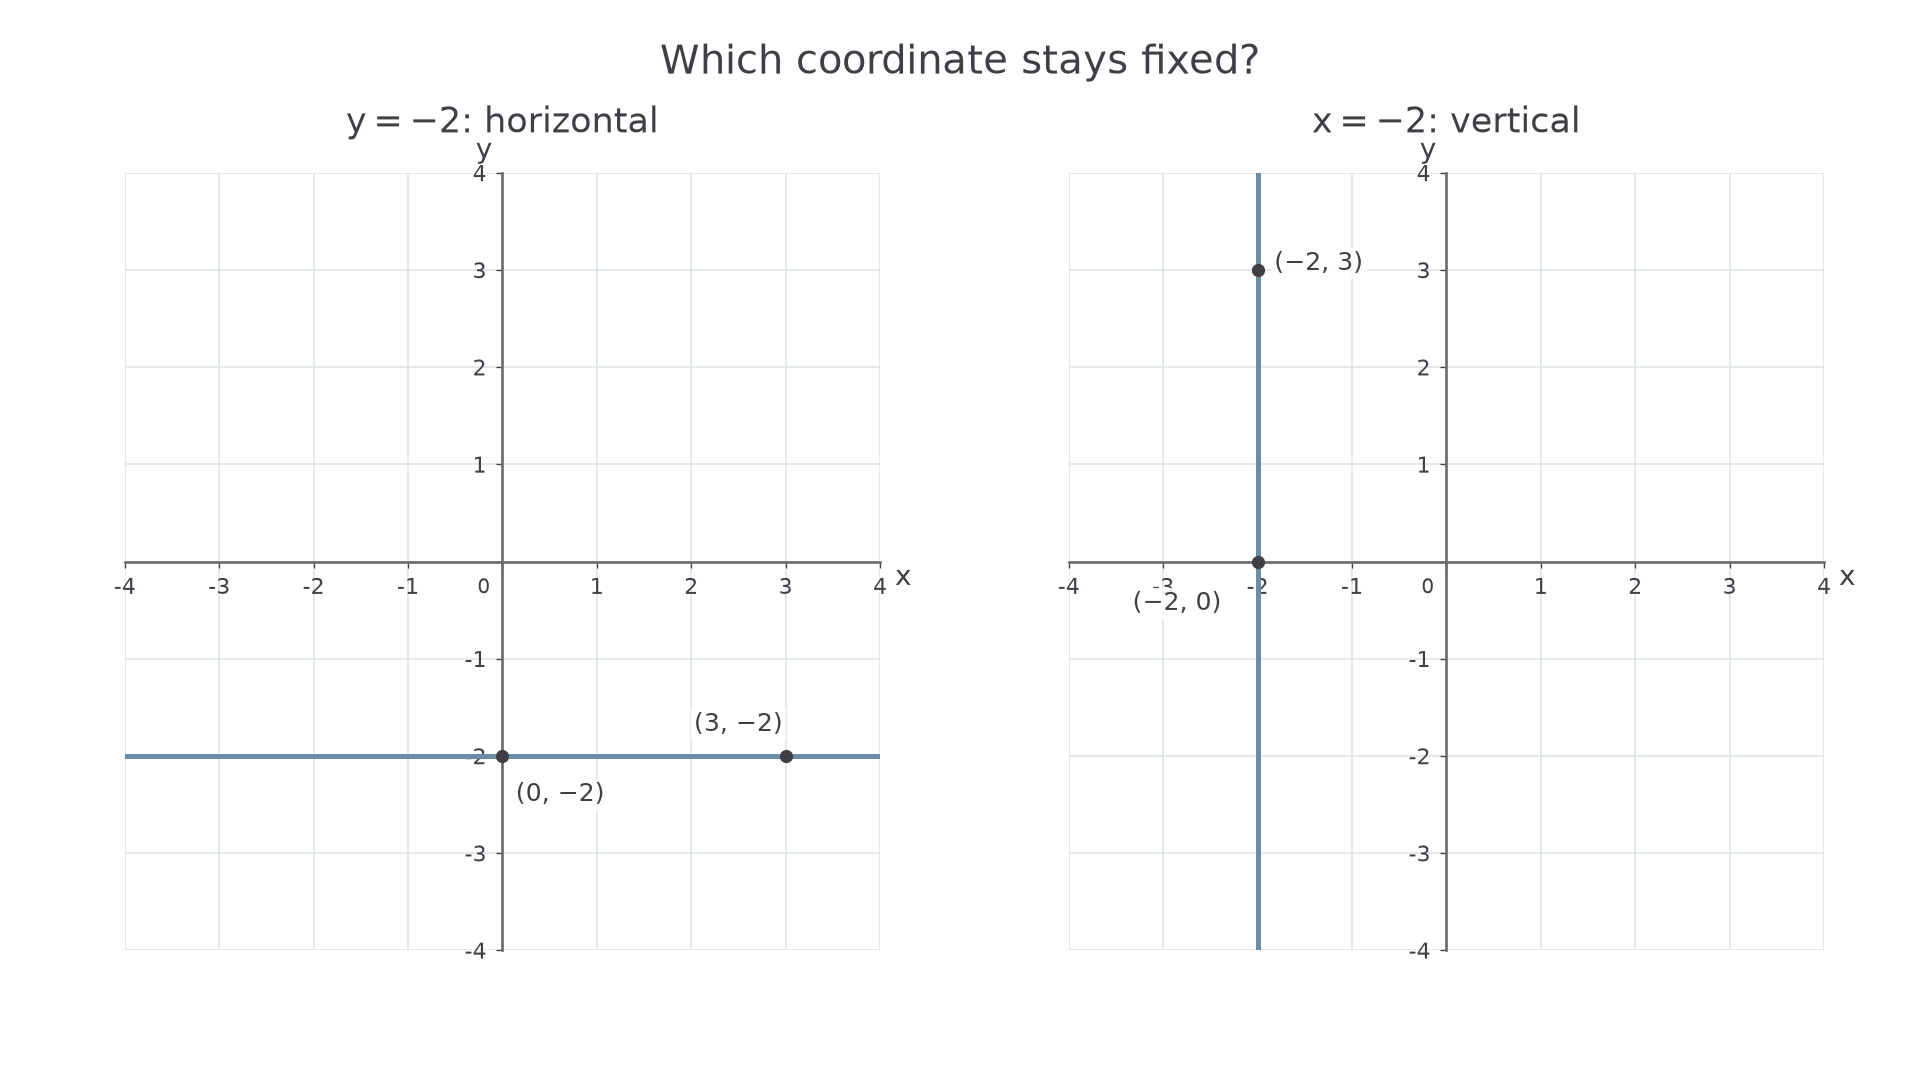
For , points such as all have height : the graph is horizontal. For , points such as all have horizontal position : the graph is vertical. Say which coordinate is fixed before choosing a direction.
Worked example 3: a fixed height
Question. Sketch , giving two points on it.
Plan. Keep the -coordinate at and choose two different -coordinates.
Answer. Draw a horizontal line through , continuing in both directions.
Check. Every point on this line is two units below the -axis, so every point has .
Keep the number , but change which coordinate is fixed. That changes the orientation.
Worked example 4: a fixed horizontal position
Question. Sketch , giving two points on it.
Plan. Keep the -coordinate at and vary .
Answer. Draw a vertical line through , continuing in both directions.
Check. Every point is two units left of the -axis. A point such as is not on it because its -coordinate is .
[DIAGRAM: asset_name: Fixed height and fixed horizontal position; asset_slug: horizontal-vertical; caption: The equation names the coordinate that stays fixed.; description: Separate grids show the horizontal line y equals negative two and the vertical line x equals negative two, each with two labelled points.]
Watch out
is the vertical -axis; is the horizontal -axis. The equation gives the coordinate that is zero, not the name of the axis.
Use the coordinate condition to decide the next pair of lines.
Gradient and intercept
A sloping straight line has a fixed rate of change, measured using coordinate values rather than the apparent angle of the drawing.
From to , the horizontal change is and the vertical change is . The gradient is . Make a large right-angled step between convenient points on a graph: it reduces reading error. Use the numerical scales, since counting squares alone fails when the axes have different scales.
Continue this lesson.
You’re previewing NovaLearn without an account. Create a free account to read the rest.
Create free account