7.01b, 7.01c - Cubic and reciprocal graphs
Can a graph have a missing input and still contain infinitely many points? Plot cubic and reciprocal curves, recognise their basic shapes, and handle expressions that combine different terms.
Cubic graphs
Squaring makes negative and positive inputs give the same result. Cubing keeps their signs: what difference should that make to a graph?
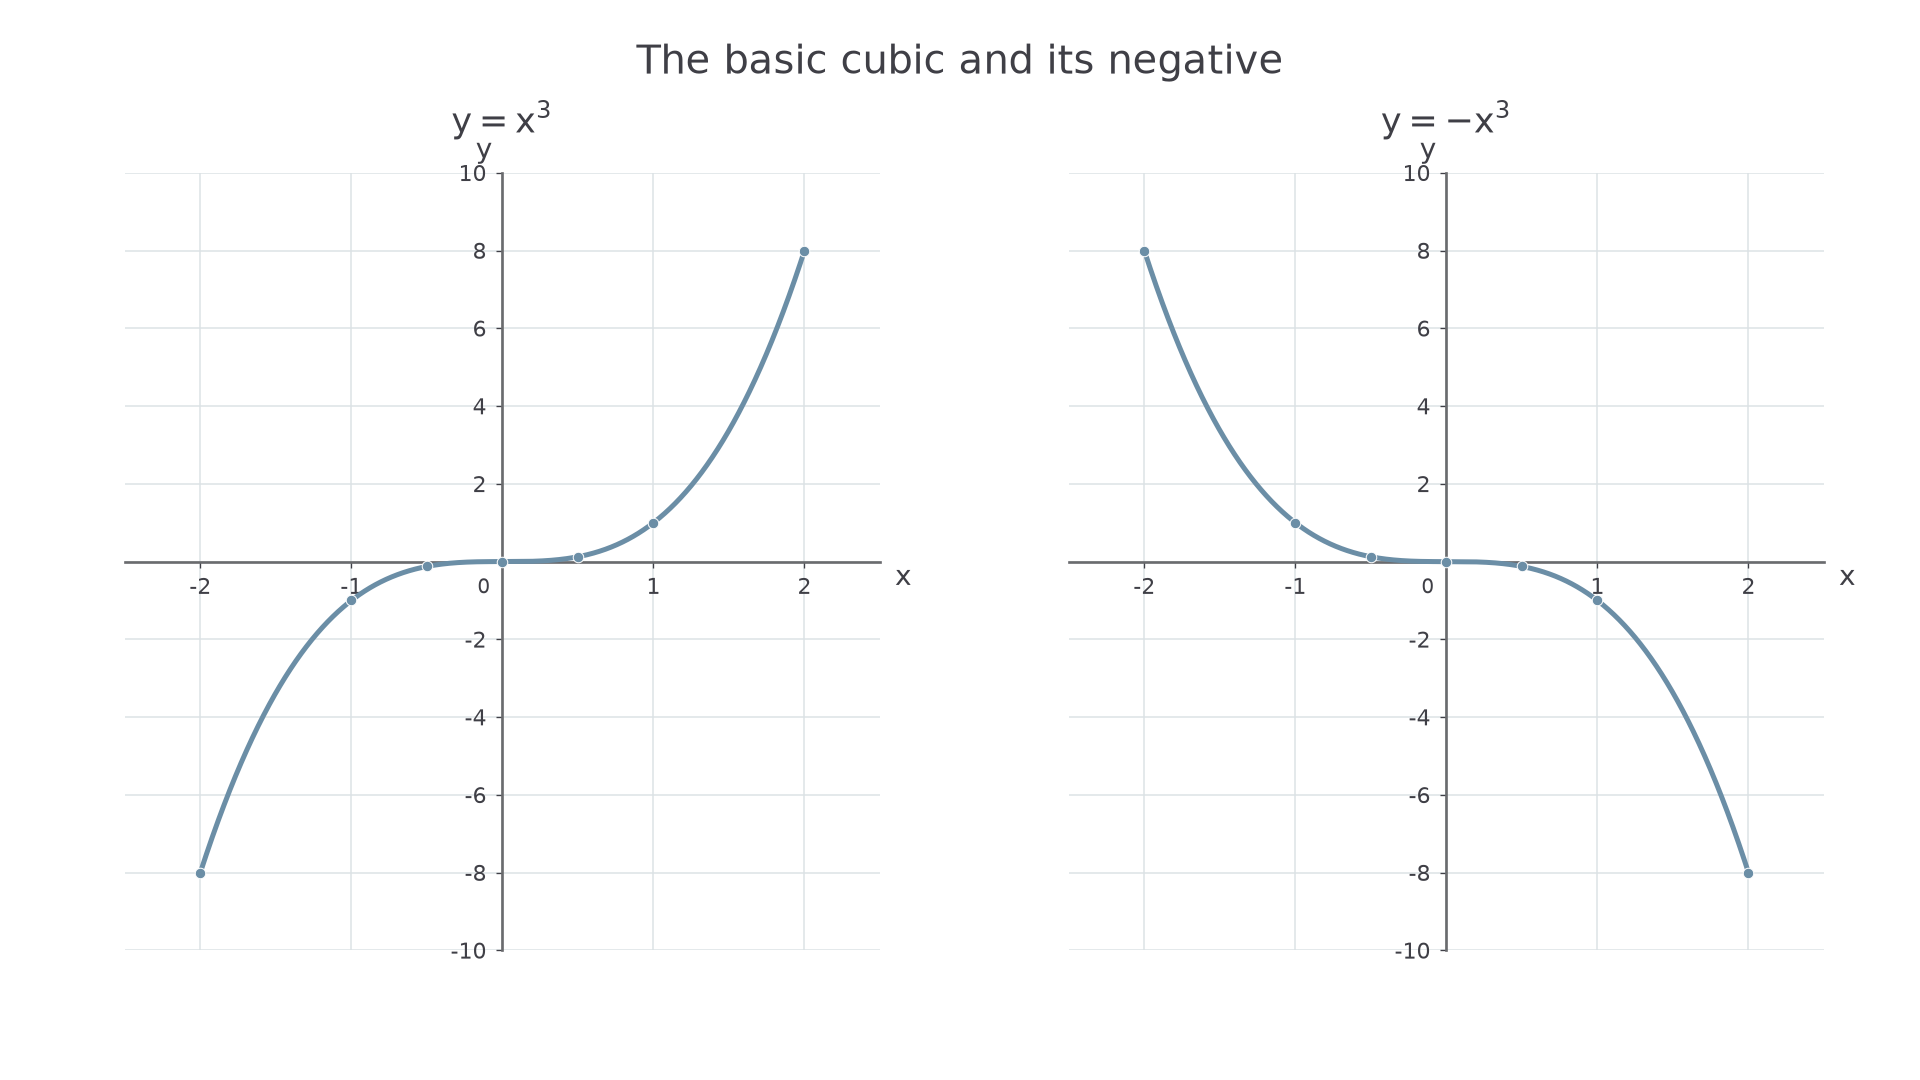
For , an input of gives , while gives . The graph passes smoothly through the origin, rising from the bottom left to the top right. It flattens near the origin but keeps increasing: the origin is not a minimum or maximum. Join calculated points with a smooth curve, not a chain of straight segments.
Cubic
A cubic expression is a polynomial whose highest power is , with a non-zero coefficient of that term. The basic graph has rotational symmetry of about the origin: opposite inputs give opposite outputs.
Other cubic expressions can have local peaks and dips. Recognising does not mean that every cubic has exactly its shape.
Worked example 1: plotting the basic cubic
Question. Plot for , using integer inputs and extra points at .
Plan. Cube each input, then use the extra central points to guide the flatter part of the curve.
Answer. Draw a smooth increasing S-shaped curve through the calculated points, passing through .
Check. Each pair of opposite inputs gives opposite outputs, for example and . Also , so the curve must pass through .
Change only the sign of the whole expression. Every nonzero height reverses.
Worked example 2: a decreasing cubic
Question. Plot over the same range.
Plan. Keep the inputs and negate the previous outputs.
Answer. Draw a smooth decreasing S-shaped curve from top left to bottom right through the origin.
Check. At , the expression is . At , it is . These opposite endpoints confirm the direction.
[DIAGRAM: asset_name: Basic increasing and decreasing cubics; asset_slug: cubic-basics; caption: Cubing preserves the input sign and negating the output reverses the direction.; description: Two scaled graphs show y equals x cubed and y equals negative x cubed over negative two to two. Seven calculated points are marked, including the half-unit inputs near the origin.]
Watch out
, whereas . Do not copy the even symmetry of a square graph onto a cubic.
Use the sign and the power separately in your next calculation.
Reciprocal graphs and missing inputs
For , the input is forbidden. Division by zero has no value, so the graph has a genuine gap between its two separate branches.
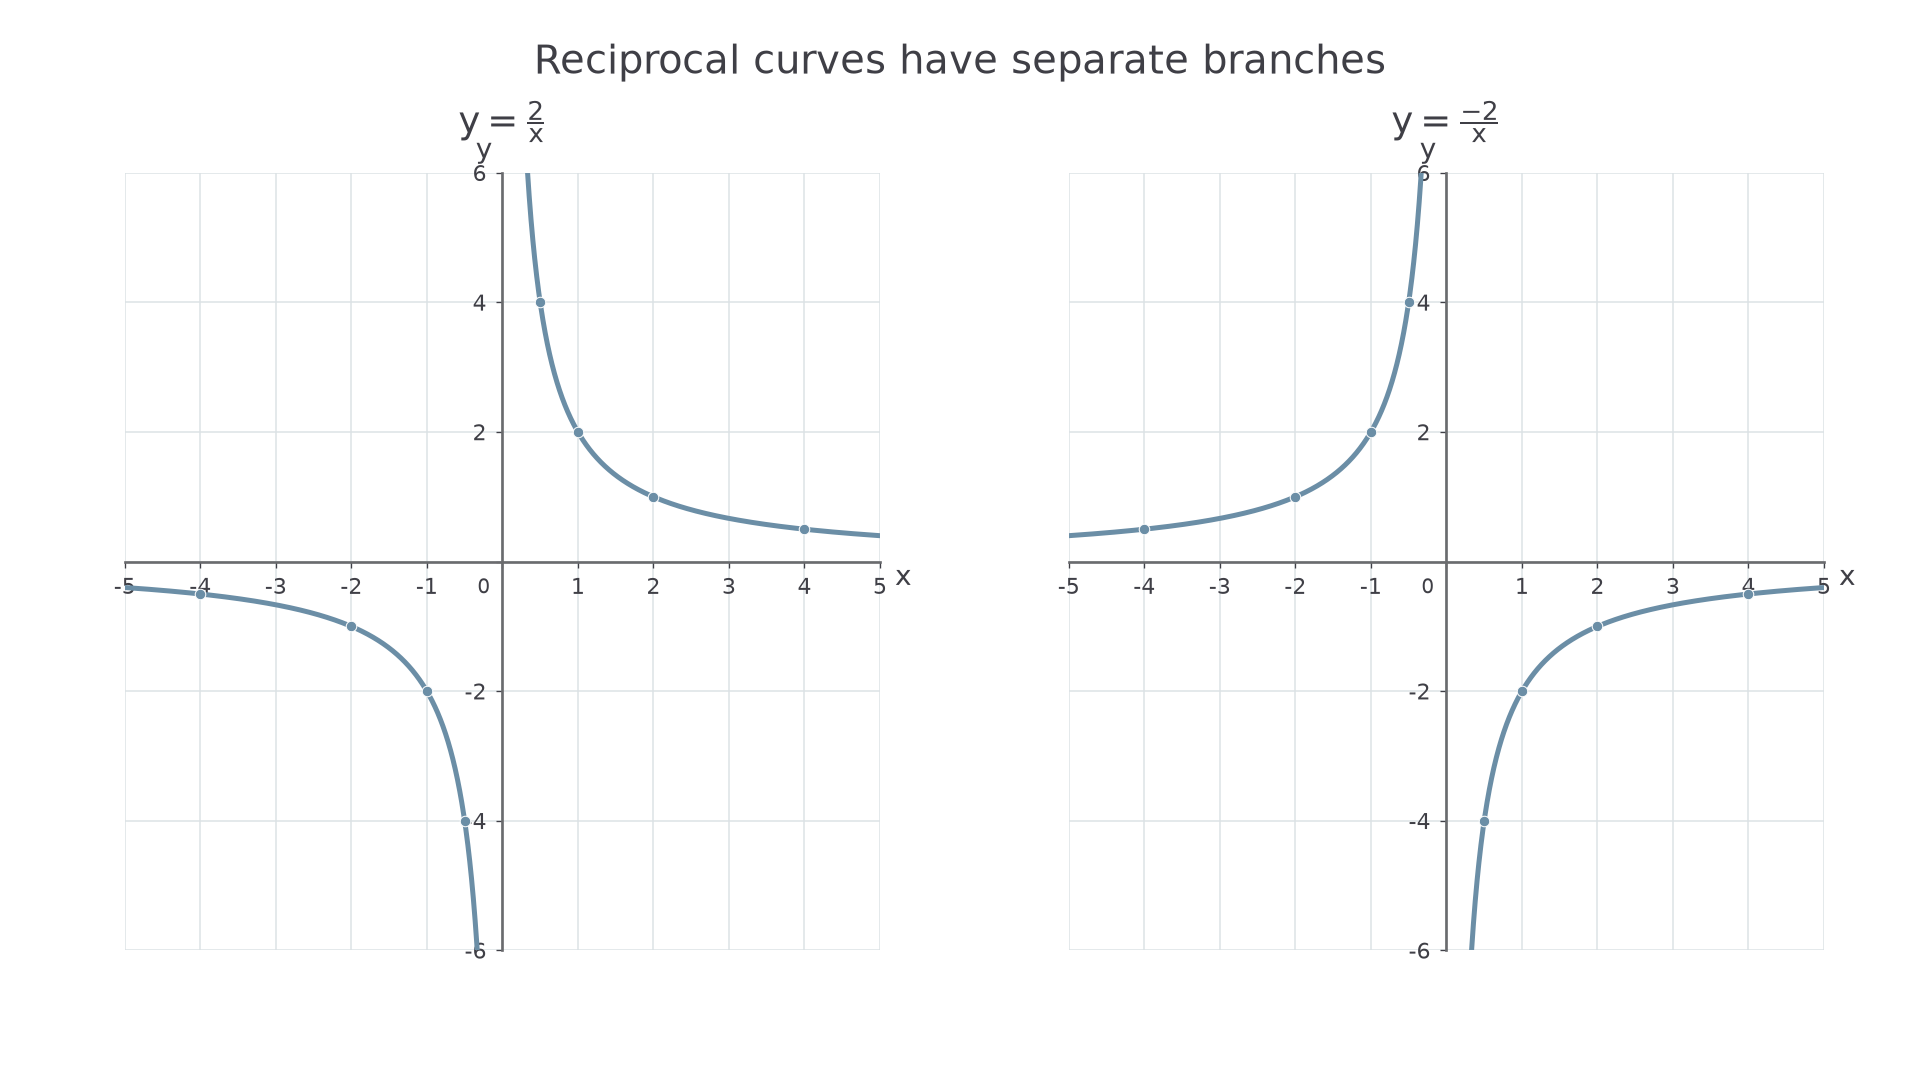
For positive inputs, the outputs are positive; for negative inputs, they are negative. The branches of therefore lie in the first and third quadrants. Near zero, the output magnitudes become very large. Far from zero, they become small, but never equal zero.
Asymptote
An asymptote is a straight line that a curve approaches in the relevant direction. For , with nonzero constant , the axes and are asymptotes. This particular curve never meets either axis.
A sketch must keep the two branches separate and show the correct quadrants and behaviour near the axes. A plot needs points on both sides of zero, including some closer to zero to reveal the steepness. Never draw a joining segment across the missing input.
Worked example 3: two positive-product branches
Question. Calculate and plot at . Explain what happens at zero.
Plan. Divide by each nonzero input and draw each side separately.
Answer. Two separate branches in quadrants one and three, approaching both axes without touching them.
Check. Every listed pair has , including . Neither coordinate can be zero while the product remains .
Change only the numerator's sign. The two branches move to the other pair of quadrants.
Worked example 4: a negative product
Question. Plot at the same inputs.
Plan. Negate each previous height and retain the break at .
Answer. Two separate branches in quadrants two and four, with the same two axis asymptotes.
Check. At , , giving . At , , again giving . The input and output signs must now differ.
[DIAGRAM: asset_name: Positive and negative reciprocal curves; asset_slug: reciprocal-basics; caption: The sign of the numerator decides which quadrants contain the branches.; description: Two scaled grids show y equals two divided by x and y equals negative two divided by x. Each curve is plotted as two disconnected branches, with the calculated points marked and the coordinate axes shown as asymptotes.]
The surprising gap has a simple reason: zero is not an allowed input. A calculator error at zero is not an output to plot.
Continue this lesson.
You’re previewing NovaLearn without an account. Create a free account to read the rest.
Create free account