7.04a, 7.04b - Real-world graphs and rates
How can a falling line describe someone travelling forwards through time? In 7.04a, learn to read and construct graphs of journeys, money conversions and proportional relationships. In 7.04b, connect straight-line gradient to a rate, using the axis labels to explain what the number means.
Reading a graph in context
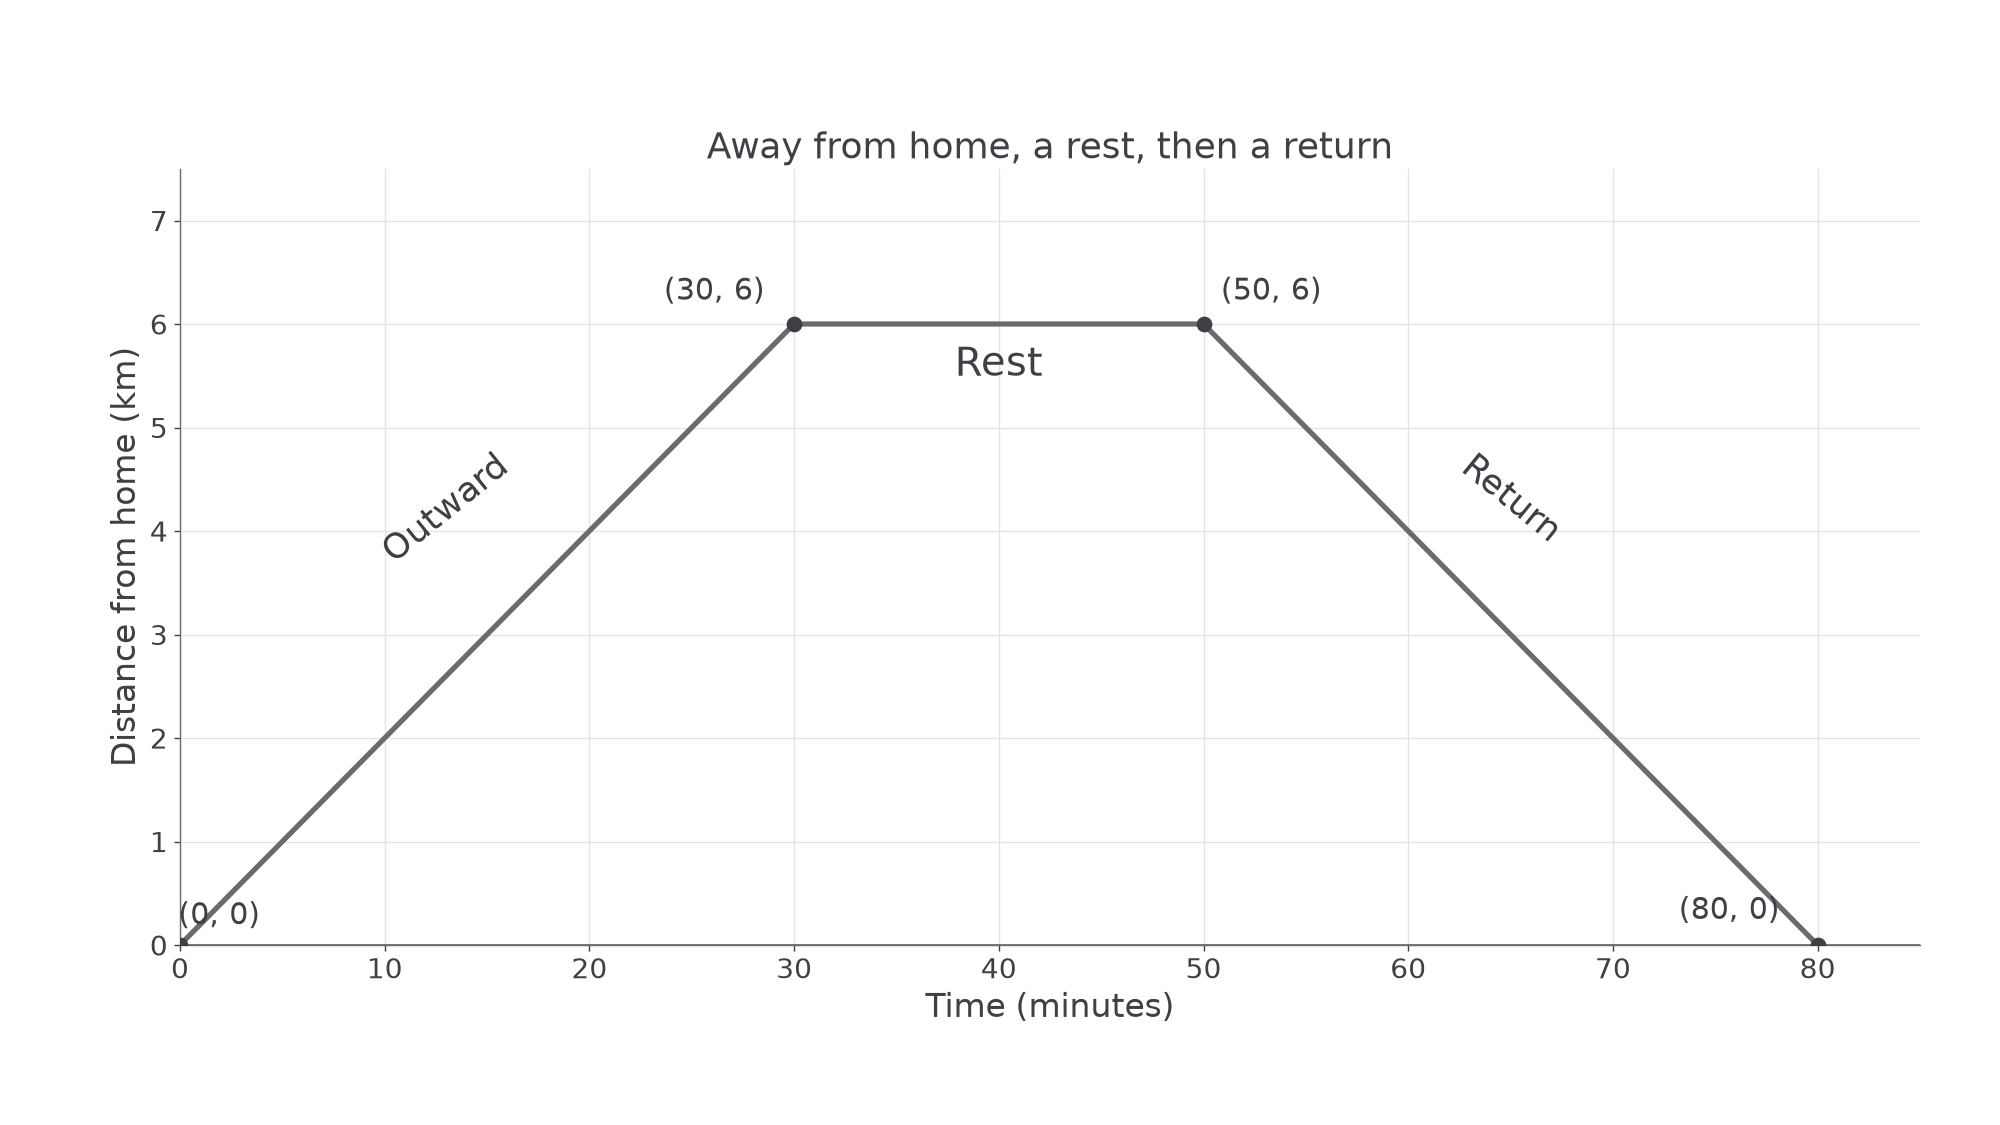
A walker moves away from home, rests, then returns. Does the returning section mean that time runs backwards? Read the axes first: time still increases to the right, while the distance from home decreases.
A graph links two quantities. The horizontal coordinate gives the input, often time; the vertical coordinate gives the corresponding output. Labels, units and the scale are part of the information. A height of six squares is not necessarily a distance of six kilometres.
[DIAGRAM: asset_name: A journey away from home and back; asset_slug: contextual-journey; caption: Time increases throughout the journey while distance from home can increase or decrease.; description: A distance-from-home graph joins the points zero zero, thirty six, fifty six and eighty zero. Time is in minutes and distance is in kilometres. The middle section is horizontal.]
Distance-time graph
A distance-time graph shows how a stated distance changes with time. Check whether the distance means distance from a starting point or total distance travelled. Total distance travelled cannot decrease, but distance from home can.
On this graph a straight sloping segment models a constant rate of change. A horizontal segment means the plotted distance does not change. In this out-and-back journey along one route, that represents a rest. Joining readings with straight segments assumes constant speed between those readings; the data alone may not establish that assumption.
Worked example 1: interpreting a rest
Question. The journey graph passes through and . How long does the walker rest, and how far from home?
Plan. Compare the times and the unchanged distance.
Answer. The walker rests for minutes, kilometres from home.
Check. Starting at minute , a -minute rest ends at minute . Both endpoints have the same height.
Now read the next segment instead. The time moves right as before; the change is that distance from home falls.
Worked example 2: interpreting a return
Question. The next segment joins to . Describe this stage and find its duration.
Plan. Read the starting and finishing distances, then subtract the times.
Answer. The walker returns kilometres to home in minutes, at a constant speed in this model.
Check. The finish has distance zero and a later time. The complete walk covers kilometres, even though the final distance from home is zero.
Other contextual graphs are read in exactly this coordinate-based way. On a conversion graph with pounds horizontally and euros vertically, the point means that converts to euros at the stated rate. Reading in reverse starts with the vertical quantity and finds the horizontal one.
Watch out
A falling distance-from-home graph means a return towards home. It does not mean a negative speed or backwards time. The axis label decides what a fall describes.
Use the same reading method on a fresh journey.
Graphs of proportional relationships
Doubling an input can double an output, or halve it. The graph shows which relationship is being used.
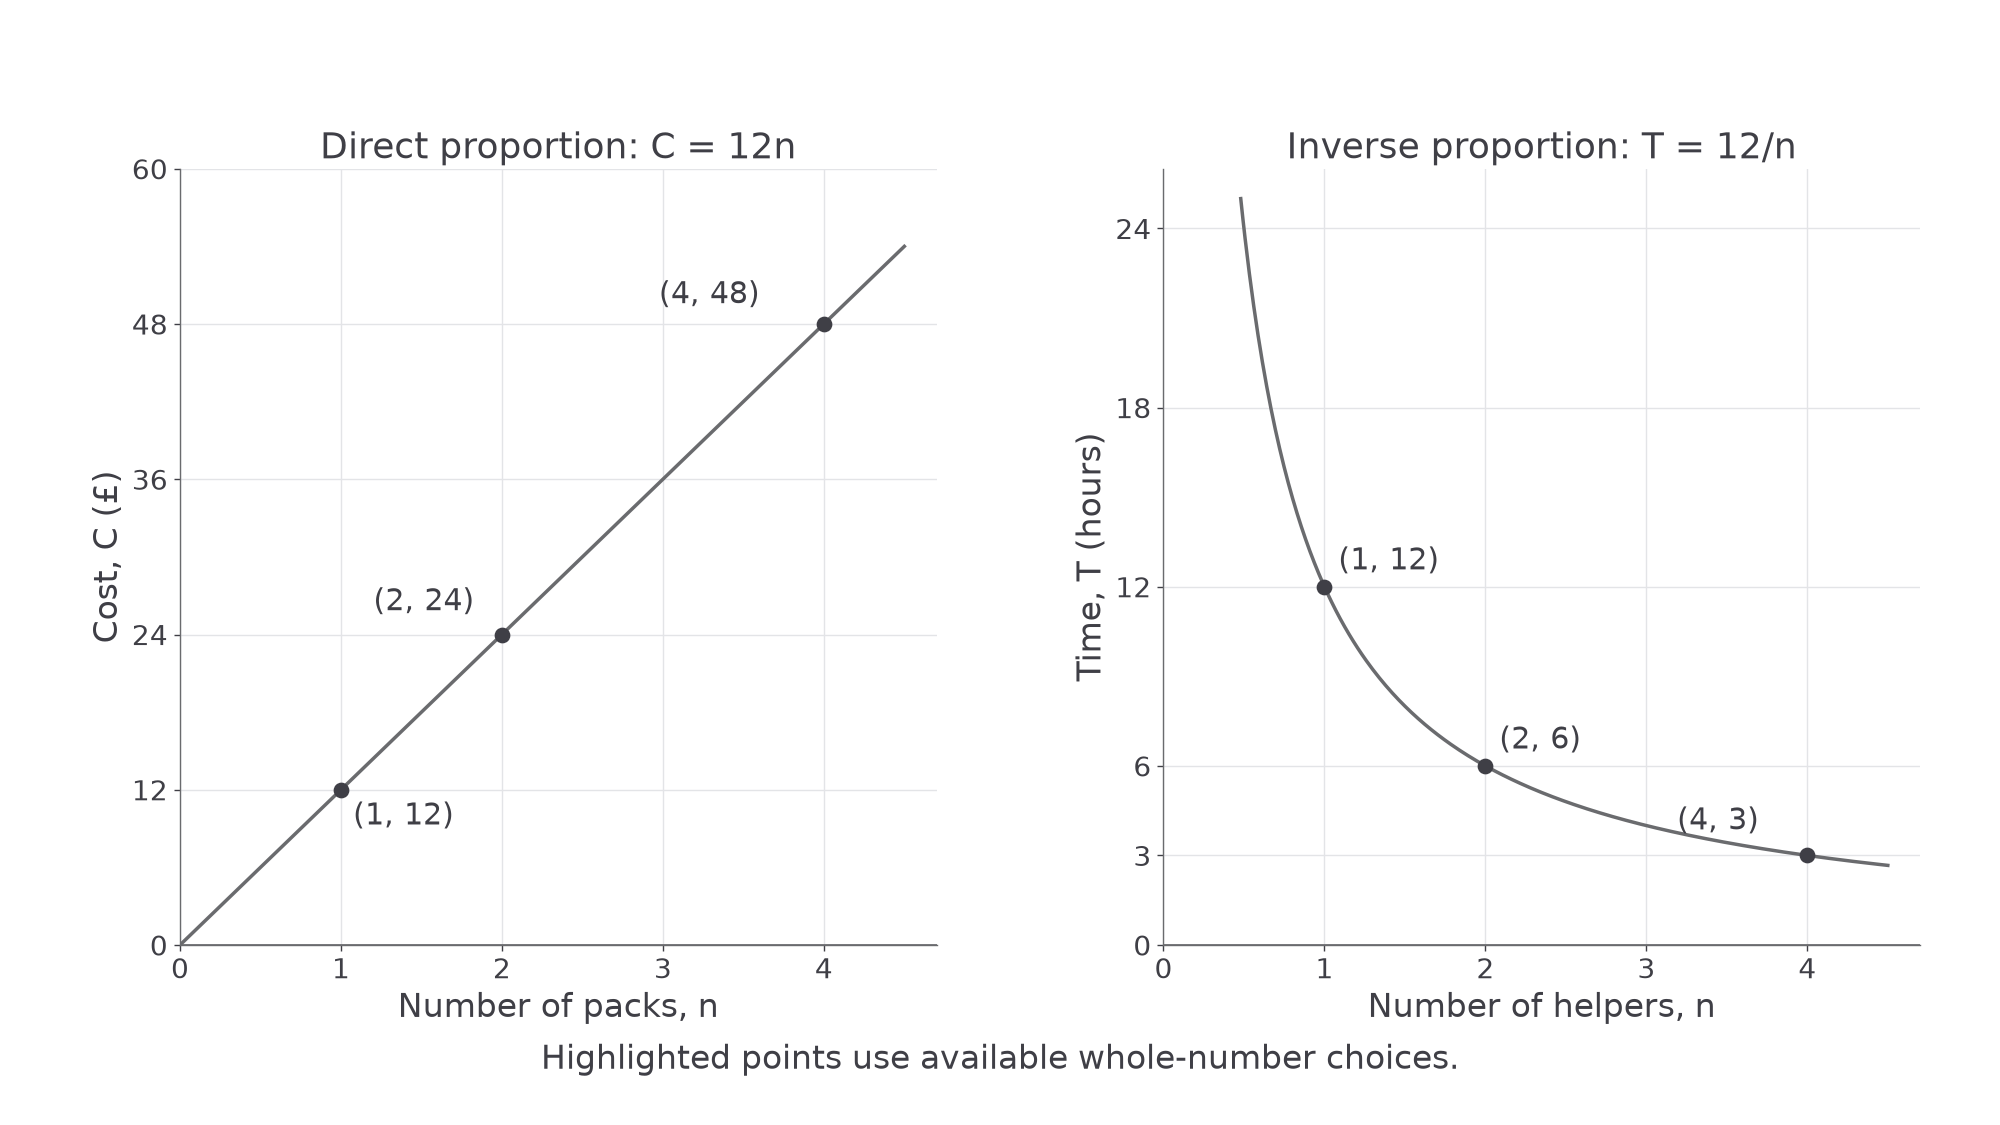
For direct proportion, : equal multiples of give equal multiples of . Its graph is a straight line through the origin. A straight line with a nonzero starting charge is not direct proportion, because doubling the input does not double the whole output.
For inverse proportion, , with : the product stays constant. In the positive-quantity examples here, doubling halves . The graph curves downwards and does not meet either axis. A decreasing graph alone is not enough to establish inverse proportion; check the constant product.
[DIAGRAM: asset_name: Direct and inverse proportion in context; asset_slug: contextual-proportions; caption: Direct proportion keeps the ratio constant while inverse proportion keeps the product constant.; description: Two graphs show cost C equals twelve n for positive pack counts and time T equals twelve divided by n for positive helper counts. The points at n equals one two and four are marked. The discrete helper and pack values are emphasised, with the curves showing the relationships.]
Worked example 3: a constant ratio
Question. Packs cost each. For , and packs, the costs are , and . Explain the graph's shape.
Plan. Compare cost divided by number of packs.
Answer. , so cost is directly proportional to the number of packs. The points lie on a straight line through .
Check. Doubling from two packs to four doubles the cost from to . Only whole-number pack counts are possible in this setting.
Keep the inputs , and , but change the relationship: the output is now the time for a fixed job shared equally.
Worked example 4: a constant product
Question. A job takes hours with one helper, hours with two and hours with four. The model assumes equal work rates and no delays. Explain the graph's shape.
Plan. Compare number of helpers multiplied by time.
Answer. , so time is inversely proportional to the number of helpers. The positive part of the model curves downwards.
Check. Doubling from two helpers to four halves the time from hours to . Zero helpers is outside the model, and half a helper is not an available choice here.
The smooth curve helps us see the relationship, but contextual restrictions still decide which points can actually occur. A model with real-number input is not permission to ignore whole people or an impossible negative duration.
Key idea
Direct proportion: constant ratio, straight line through the origin. Inverse proportion: constant product, reciprocal curve. Check the relationship as well as the appearance.
Decide which invariant fits this new table.
Continue this lesson.
You’re previewing NovaLearn without an account. Create a free account to read the rest.
Create free account