12.02a - Tables and charts
Can two pie charts have identical sectors even when one survey contains twice as many people? You will classify and tabulate data, build suitable charts and compare groups without confusing a count with a proportion. A useful display makes the question easier to answer while preserving what the data mean.
Classifying and tabulating data
A list of survey answers is data, but it may hide the pattern. Before counting, decide what kind of answer each observation contains and what the categories mean.
Types of data
Categorical data describe groups, such as travel method or eye colour. Numerical data describe quantities. A discrete numerical variable takes separate possible values, often counts such as the number of pets. A continuous numerical variable can take any value within a measurement interval, such as journey time.
A number used as a label is not automatically a numerical measurement: bus route 12 is a category, while 12 passengers is a count. A measured time remains continuous even if it is recorded to the nearest minute.
A frequency is how many observations fall in a category or take a value. Make categories clear and non-overlapping when each person must have one answer. For travel data, specify “main method” if a journey can involve both walking and a bus. Add a suitable “other” category when the named choices do not cover everybody.
Worked example 1: a frequency table
Question. Ten students report their main travel method:
walk, bus, walk, cycle, bus, walk, bus, cycle, walk, bus.
Classify the data and make a frequency table.
Plan. Treat the methods as categories and count each answer once.
| Main method | Walk | Bus | Cycle | Total |
|---|---|---|---|---|
| Frequency | 4 | 4 | 2 | 10 |
Answer. These are categorical data, with frequencies .
Check. Recount by position: walking occurs at positions , buses at , and cycling at . All ten answers appear once.
Add one feature: the first five students belong to group A and the last five to group B. A two-way table preserves both classifications instead of losing the group information.
Worked example 2: adding a second classification
Question. For the same ordered answers, construct a two-way table showing travel method by group.
Plan. Use rows for the two groups, columns for methods and totals to check both directions.
| Group | Walk | Bus | Cycle | Total |
|---|---|---|---|---|
| A: first five | 2 | 2 | 1 | 5 |
| B: last five | 2 | 2 | 1 | 5 |
| Total | 4 | 4 | 2 | 10 |
Answer. Each group contains two walkers, two bus users and one cyclist.
Check. The column totals recover the first table; the row totals recover the stated group sizes.
Use informative headings, include units for measurements and check that every observation has one place. If you classify numerical measurements into intervals, boundaries must not overlap: for example, “less than 10 minutes” and “10 minutes or more” cover the boundary without counting it twice.
Watch out
Do not call eye colour “discrete numerical” just because it has a small number of categories. The values are descriptions, not quantities. Likewise, rounding a continuous measurement does not change the underlying variable into a count.
Choose a table for a fresh short list.
Bar and vertical-line charts
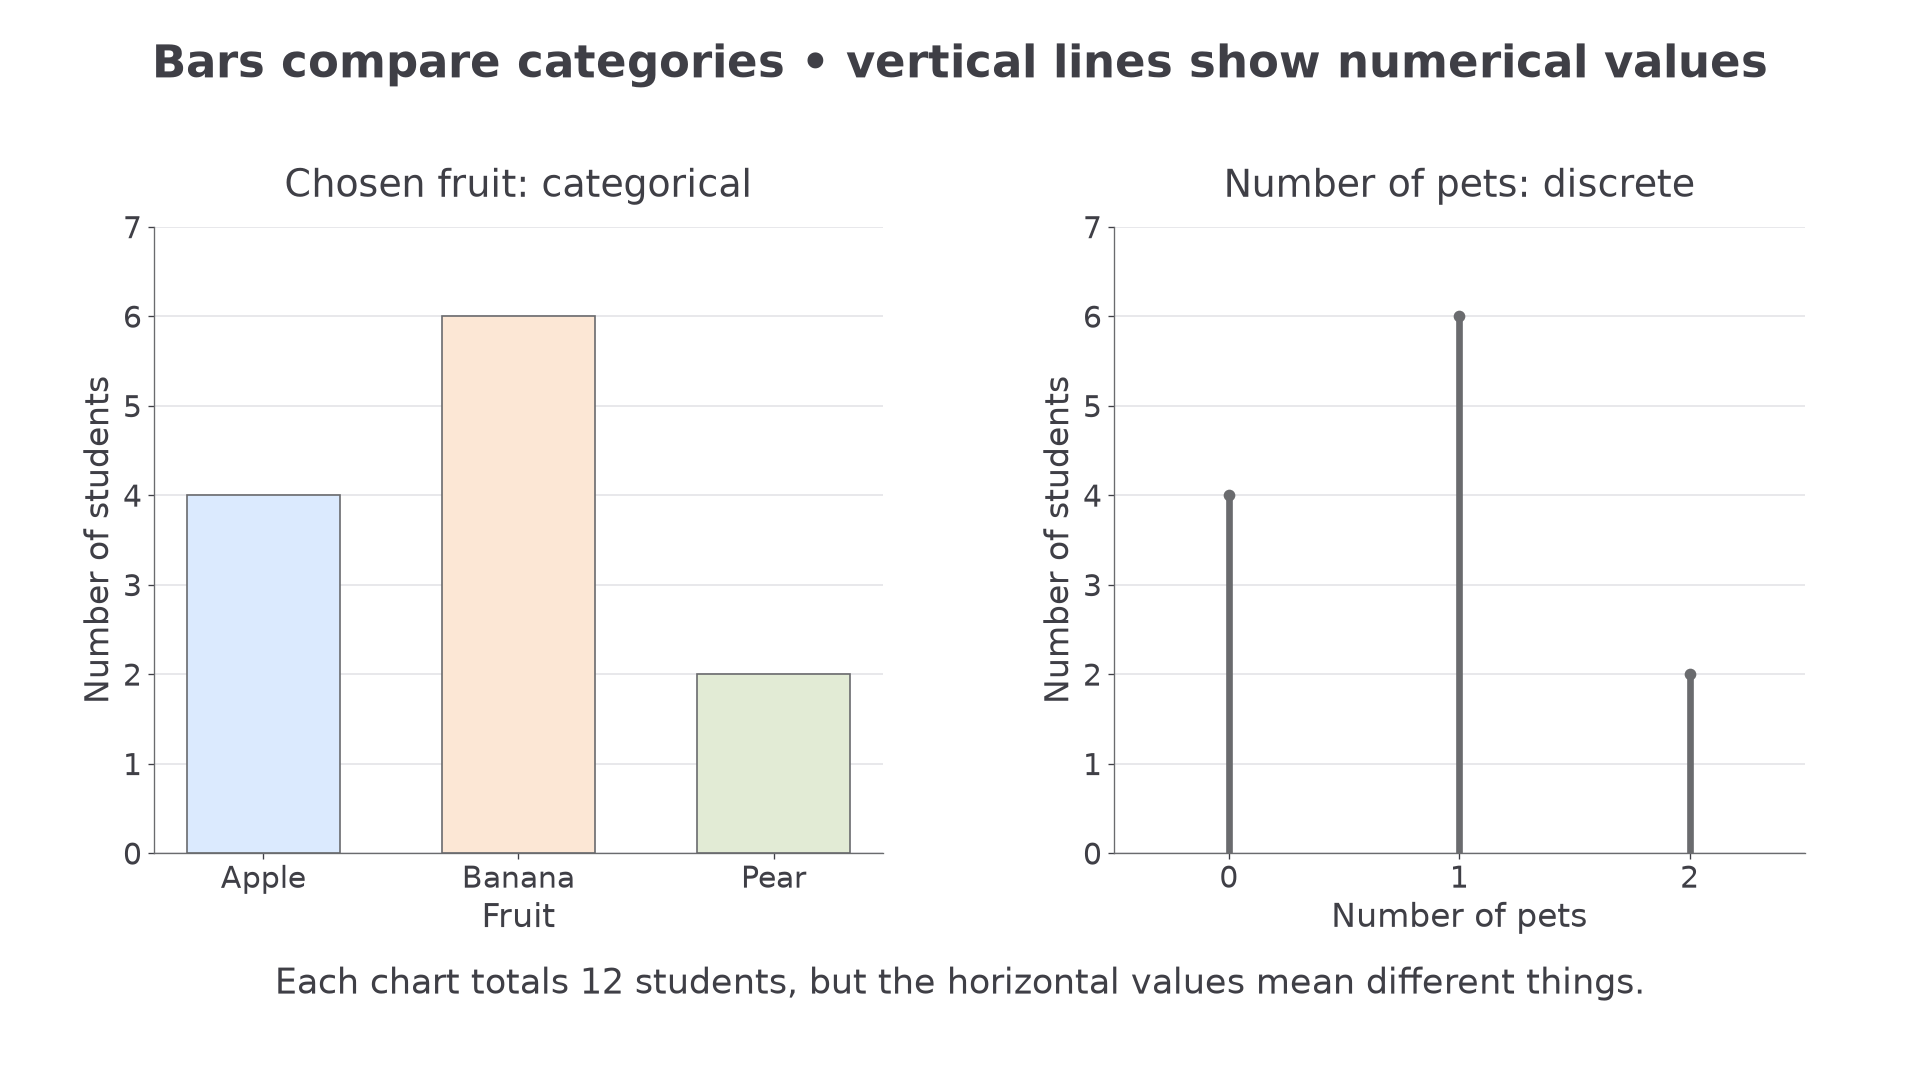
A bar chart compares category frequencies. A vertical-line chart puts ungrouped discrete numerical values in their numerical positions and shows frequency by line height. Both need a clear scale, labelled axes and a title saying what was measured.
Bars and vertical lines
A bar chart uses equal-width separated bars for categories. A vertical-line chart uses thin vertical lines at the actual discrete values. In each, height gives frequency. For a frequency display, use a zero baseline and a consistent scale so the heights compare honestly.
To construct either chart, first identify the horizontal values and the largest frequency. Choose a vertical scale covering that largest frequency, mark equal numerical intervals and plot the correct heights. Category gaps in a bar chart have no numerical meaning; spacing between numerical values in a vertical-line chart does.
[DIAGRAM: asset_name: Category bars and numerical lines; asset_slug: bars-and-vertical-lines; caption: Bar categories and numerical values require different horizontal arrangements.; description: Two charts share frequencies 4, 6 and 2. The left bar chart has apple, banana and pear categories and separated equal-width bars. The right vertical-line chart has pet counts 0, 1 and 2 at equally spaced numerical positions. Both vertical axes begin at zero and are labelled number of students.]
Worked example 3: constructing category bars
Question. Twelve students choose one fruit each: apple , banana , pear . Describe how to construct the bar chart and find how many more choose banana than pear.
Plan. Put fruit categories on the horizontal axis and frequency on a scale from zero to six.
Answer. Draw equal-width separated bars of heights , with labelled fruit categories and a frequency axis. Four more students choose banana than pear.
Check. The bar heights total , matching the number surveyed.
Change only the frequency of pear to five. The chart's scale can stay unchanged, but its final bar and comparisons change.
Worked example 4: changing one bar
Question. Another survey gives apple , banana , pear . Describe the new chart and compare banana with pear.
Plan. Keep the same axes and widths, changing the pear height.
Answer. The pear bar rises to five; banana is still tallest, by one student.
Check. The total is now , three more than before, exactly the increase in pear frequency.
Now the horizontal values are numerical counts. For pets, use a line at each number rather than treating those values as unrelated names.
Worked example 5: constructing vertical lines
Question. A survey gives pets: students, pet: , and pets: . Describe a vertical-line chart and find the number with at least one pet.
Plan. Use a numerical pets axis, then add frequencies at one and two.
Answer. Draw lines from height zero to at pets respectively. Eight students have at least one pet.
Check. Four of the twelve students have no pets; confirms the answer.
Change only the largest pet value from two to four, keeping its frequency two. Numerical spacing must now show the missing values.
Worked example 6: retaining numerical gaps
Question. Frequencies are now pets: , pet: , and pets: , with no students at two or three. Describe the new vertical-line chart and find how many have at least two pets.
Plan. Put the last line at , not immediately after .
Answer. Keep a uniform pets scale through , with no positive-height lines at two or three. Two students have at least two pets.
Check. The total frequency remains , and only the final group satisfies the requested condition.
For continuous measurements, individual-value vertical lines are usually unsuitable: measurements may need grouping. Do not join the tops of the pet-frequency lines as though they described change over time. A time-series line graph has a different purpose, developed in the next lesson.
Watch out
Starting the frequency axis at five can make a bar of height six look much larger than one of height five. Read the scale rather than judging the drawn lengths. In your own frequency bar or vertical-line chart, start at zero.
Interpret fresh discrete counts without drawing.
Pie charts and pictograms
A pie chart shows proportions of one complete group. A pictogram shows counts through a key telling you how many observations each symbol represents. Read the whole and the key before comparing the pictures.
Pie-chart sectors
For a category with frequency in a total of ,
Conversely, a sector of angle represents the fraction of the total. Not on the 2027 formula sheets: learn the proportion relationship.
Continue this lesson.
You’re previewing NovaLearn without an account. Create a free account to read the rest.
Create free account