7.01b, 7.01d - Exponential graphs
A graph can keep falling without ever reaching zero. In 7.01b you will plot exponential values, then in 7.01d you will recognise growth, decay and the special case between them. These are Higher-tier graph skills.
Plotting exponential values
If a quantity halves each time you move one unit to the right, will its graph ever cross the horizontal axis? Start by plotting a simpler multiplier: doubling.
For , the variable is the exponent. The base stays fixed. This differs from , where the variable is the base. Negative powers give reciprocals: , not .
Exponential graph
An exponential graph has the variable in the exponent, such as or . We use a positive base so that the graph is defined for every real .
A table gives accurately placed points. Choose scales that include the largest value, plot each coordinate, and draw a smooth curve through the points. Integer inputs are sampling points: the graph also contains values between them.
Worked example 1: plotting powers of two
Question. Complete a table and plot for .
Plan. Evaluate the powers, then plot the ordered pairs on suitable axes.
Answer. Plot , , , , and join with a smooth increasing curve.
Check. Each one-unit increase in doubles , including to . The changes in are not equal, so a straight line would be wrong.
Now change only the multiplier outside the power. Calculate the power before multiplying.
Worked example 2: a multiplier before the power
Question. Complete a table and plot over the same interval.
Plan. Multiply each value from the previous table by .
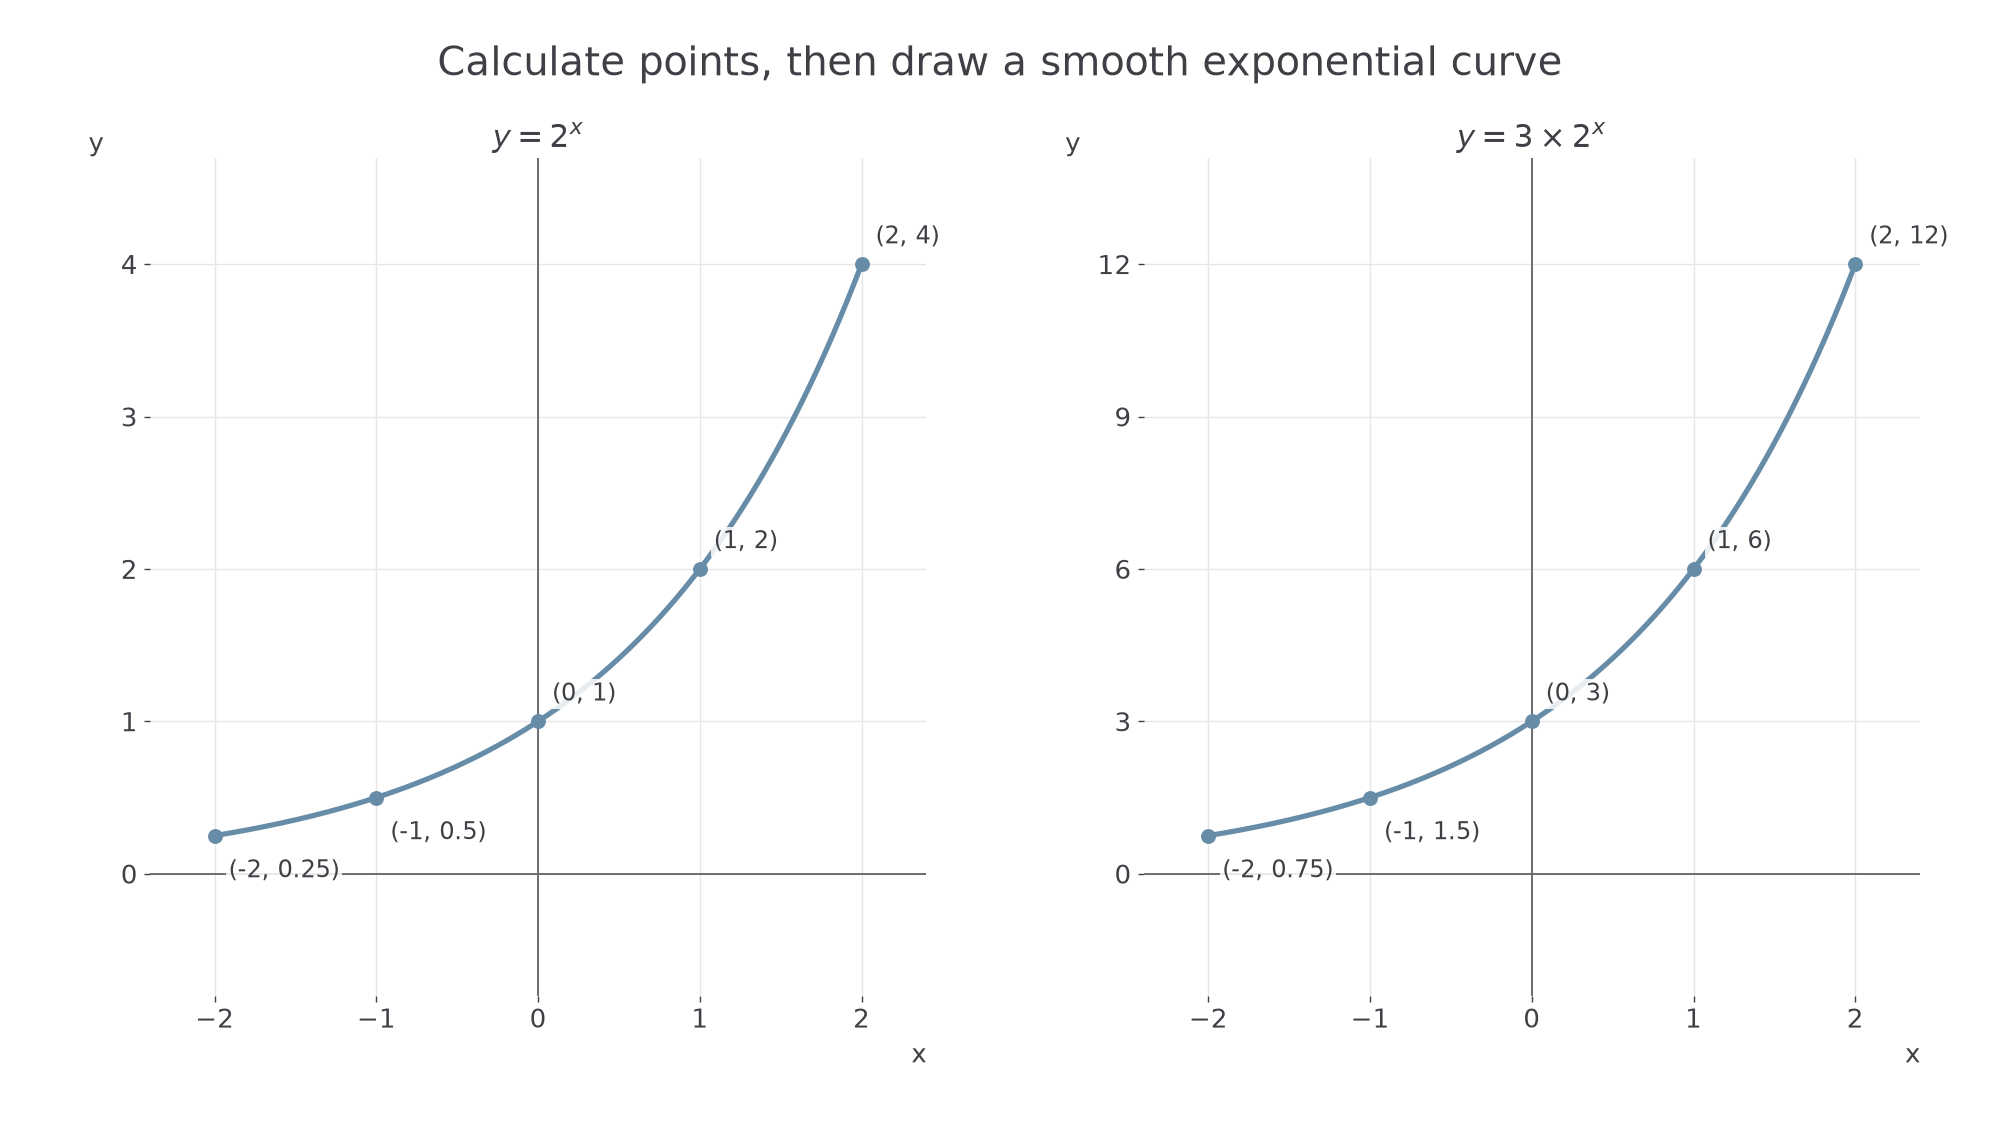
Answer. Plot these five coordinates with a vertical scale reaching , then draw a smooth increasing curve.
Check. The outputs still double for each unit step. At , direct substitution gives , agreeing with the table.
The two plots show the same repeated-multiplication pattern at different heights.
[DIAGRAM: asset_name: Plotting two exponential tables; asset_slug: exponential-tables; caption: Accurate table points lie on smooth curves, with vertical intercepts one and three.; description: Two coordinate plots show y equals two to the power x and y equals three times two to the power x from x negative two to two. All five integer-input table points are marked on each curve.]
For a decimal base, such as , use the same procedure with a calculator. Keep sufficient digits when calculating, then plot to the precision the grid allows.
Watch out
is not . At , the first gives , while the second gives . Brackets and the position of the exponent matter.
Apply the table method to a fresh multiplier.
Growth and decay graph shapes
The base decides whether the positive outputs grow or decay as you move to the right.
Compare with . The first repeatedly multiplies by , and the second by . For , increasing by one multiplies the output by , because .
Key idea
For , if the curve increases. If it decreases. Both have vertical intercept , positive outputs and no horizontal-axis intercept.
The -axis is a horizontal asymptote for these nonconstant curves: the graph gets arbitrarily close to it in one direction without reaching it. Growth approaches zero far to the left; decay approaches zero far to the right.
Worked example 3: recognising growth
Question. Sketch , labelling the intercept and two other points. Describe its behaviour as increases.
Plan. Use three easy powers to anchor the shape, then apply repeated multiplication.
Answer. Draw a smooth increasing curve through , , . It remains above the -axis, approaches it to the left, and grows without bound to the right.
Check. Moving from to to triples the output each time. This checks the direction of growth.
Continue this lesson.
You’re previewing NovaLearn without an account. Create a free account to read the rest.
Create free account