12.03a - Averages and spread
One number can describe the centre of a data set, but it cannot tell the whole story. You will calculate mean, median, mode and range, including from frequency tables, and choose fair summaries for comparisons. You will see why one unusually large value can change some summaries while leaving others alone.
Mean, median and mode
Five friends wait 2, 3, 3, 4 and 8 minutes for buses. Which single waiting time would you use to describe their experience?
Sharing their total waiting time equally gives minutes each. Taking the middle of their ordered times gives 3 minutes. Taking the most frequent time also gives 3 minutes. These are three different averages, or measures of centre, answering different questions.
Three averages
The mean is the sum of the values divided by their number. The median is the middle value after ordering the data. The mode is the most frequent value.
The mean treats the data as a total shared equally, so the divisor counts observations, including repeated values. For an even number of observations there are two middle positions: the median is their mean. For instance, the middle of is , even though 5 was not recorded. With ordered values, the middle position is ; a half-position indicates the two surrounding positions.
A mode can be a category, such as the most common shoe colour. There can be two or more modes tied for greatest frequency. If every value appears only once, we normally report “no mode”. For , both 1 and 4 are modes; do not average them.
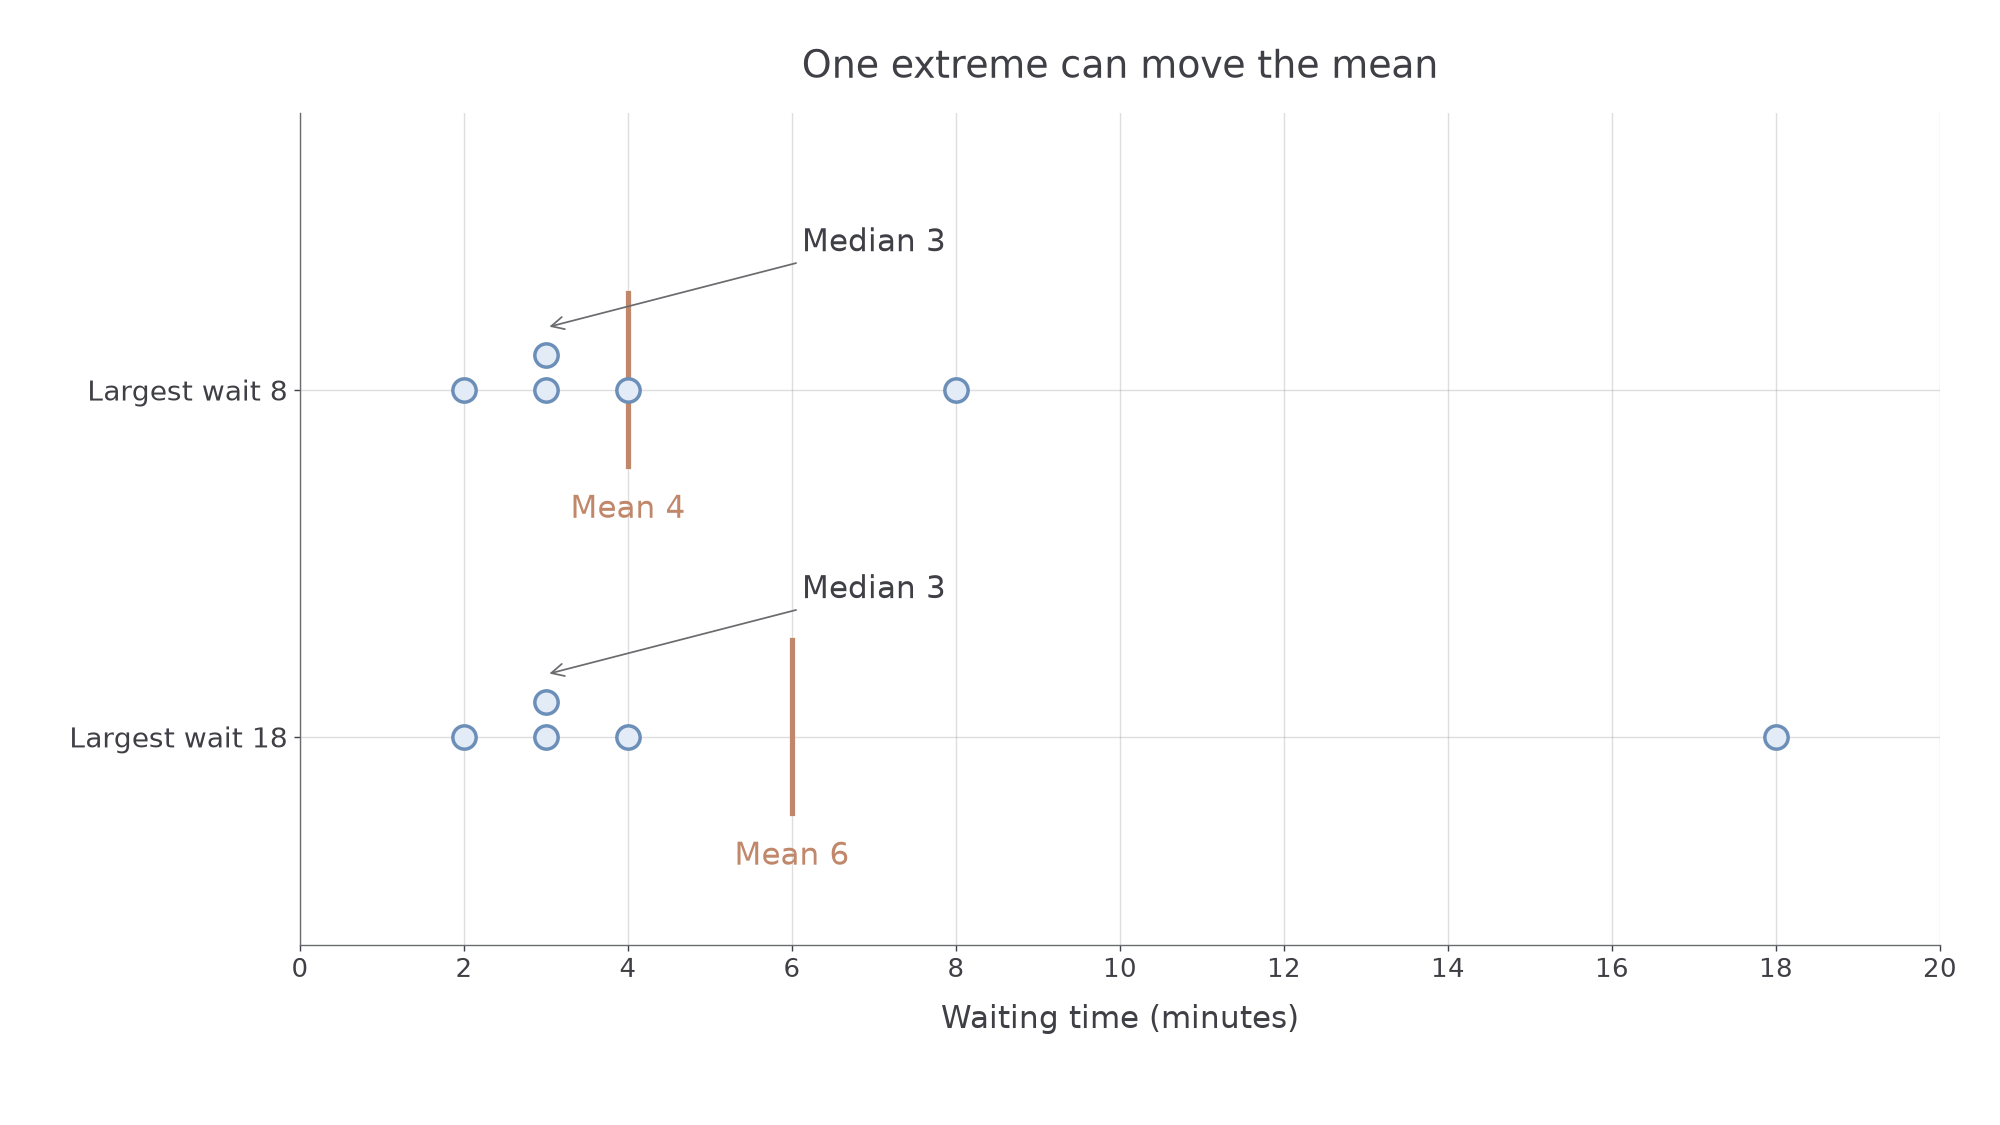
[DIAGRAM: asset_name: Changing one extreme observation; asset_slug: changing-an-extreme; caption: Changing the largest wait from 8 to 18 moves the mean but leaves the median and mode at 3.; description: Two aligned dot plots show waiting times 2, 3, 3, 4, 8 and 2, 3, 3, 4, 18. The means are marked at 4 and 6, with the median marked at 3 in both.]
Worked example 1: three answers to one question
Question. Find the mean, median and mode of minutes.
Plan. Add and divide for the mean, then use the ordered positions and repetitions for median and mode.
Answer. Mean 4 minutes, median 3 minutes, mode 3 minutes.
Check. The mean is between the smallest and largest waits and , the total. There are two observations on each side of the third observation.
Change only the largest wait, from 8 to 18 minutes.
Worked example 2: an average moves without most values moving
Question. Find the three averages of minutes.
Plan. Recalculate the total, then check whether the middle position or repetitions changed.
Answer. Mean 6 minutes, median 3 minutes, mode 3 minutes.
Check. The total rose by 10, so the mean rose by . Neither the order of the middle observation nor the most frequent value changed.
This explains the useful surprise: most people's waits did not change, yet the mean increased. The mean uses every value; the median depends on ordered positions and is less sensitive to the size of an extreme value.
Watch out
Order the observations before finding the median. The middle of the written list is irrelevant when the list is unordered.
Find all three summaries for a fresh set of waits.
Range and spread
Two groups can have the same median while their values are very differently spread out.
The range is the largest value minus the smallest. It measures the full spread in the original units. A small range means the observed values lie close together. A large range tells us the extremes are far apart, but does not tell us where the other values lie.
For a nonempty numerical data set, the range is non-negative. It is zero when all its values are equal, including a data set with only one observation.
Only the two extremes enter this calculation. Changing an interior observation without changing the extremes leaves the range unchanged.
Worked example 3: the full width of the data
Question. Find the range of minutes.
Plan. Identify the extremes and subtract the smaller from the larger.
Answer. 6 minutes.
Check. Starting at 2 and moving 6 minutes reaches 8. The range is a duration, not a count of listed observations.
Change only the maximum, as in the earlier averages.
Worked example 4: the effect of a larger extreme
Question. Find the range of minutes and compare it with the previous set.
Plan. Keep the minimum and replace the maximum.
Answer. 16 minutes, which is 10 minutes larger than before.
Check. The maximum increased by 10 while the minimum stayed fixed, so the range must also increase by 10. Both sets still have median 3.
For signed data, subtract the signed minimum: the range of temperatures is degrees, not 2 degrees.
Watch out
The range is one number, not “2 to 18”. Those are the extremes. A range of 16 minutes does not tell you the median or the most frequent wait.
Identify the extremes before calculating.
Averages from frequency tables
A frequency table compresses repeated observations without losing their individual values.
Continue this lesson.
You’re previewing NovaLearn without an account. Create a free account to read the rest.
Create free account