12.03c, 12.03d - Scatter graphs and outliers
Two measurements can move together without one causing the other. In 12.03c you will plot paired data, interpret correlation and use a line of best fit to make cautious predictions. In 12.03d you will investigate unusual observations, distinguishing a possible error from a genuine exception.
Plotting paired data
If pupils who practise longer tend to score more highly, can practice time predict a particular pupil's score? First we need a graph that keeps each pupil's two measurements together.
Bivariate data records two variables for each person or object. A scatter diagram plots one point for each pair. Choose one variable for the horizontal axis and one for the vertical axis, label both with units, and use consistent numerical scales. Do not join consecutive points: there is no time sequence connecting different pupils.
Paired observation
A paired observation contains two measurements from the same individual or object. Plot it as , keeping its horizontal and vertical measurements together.
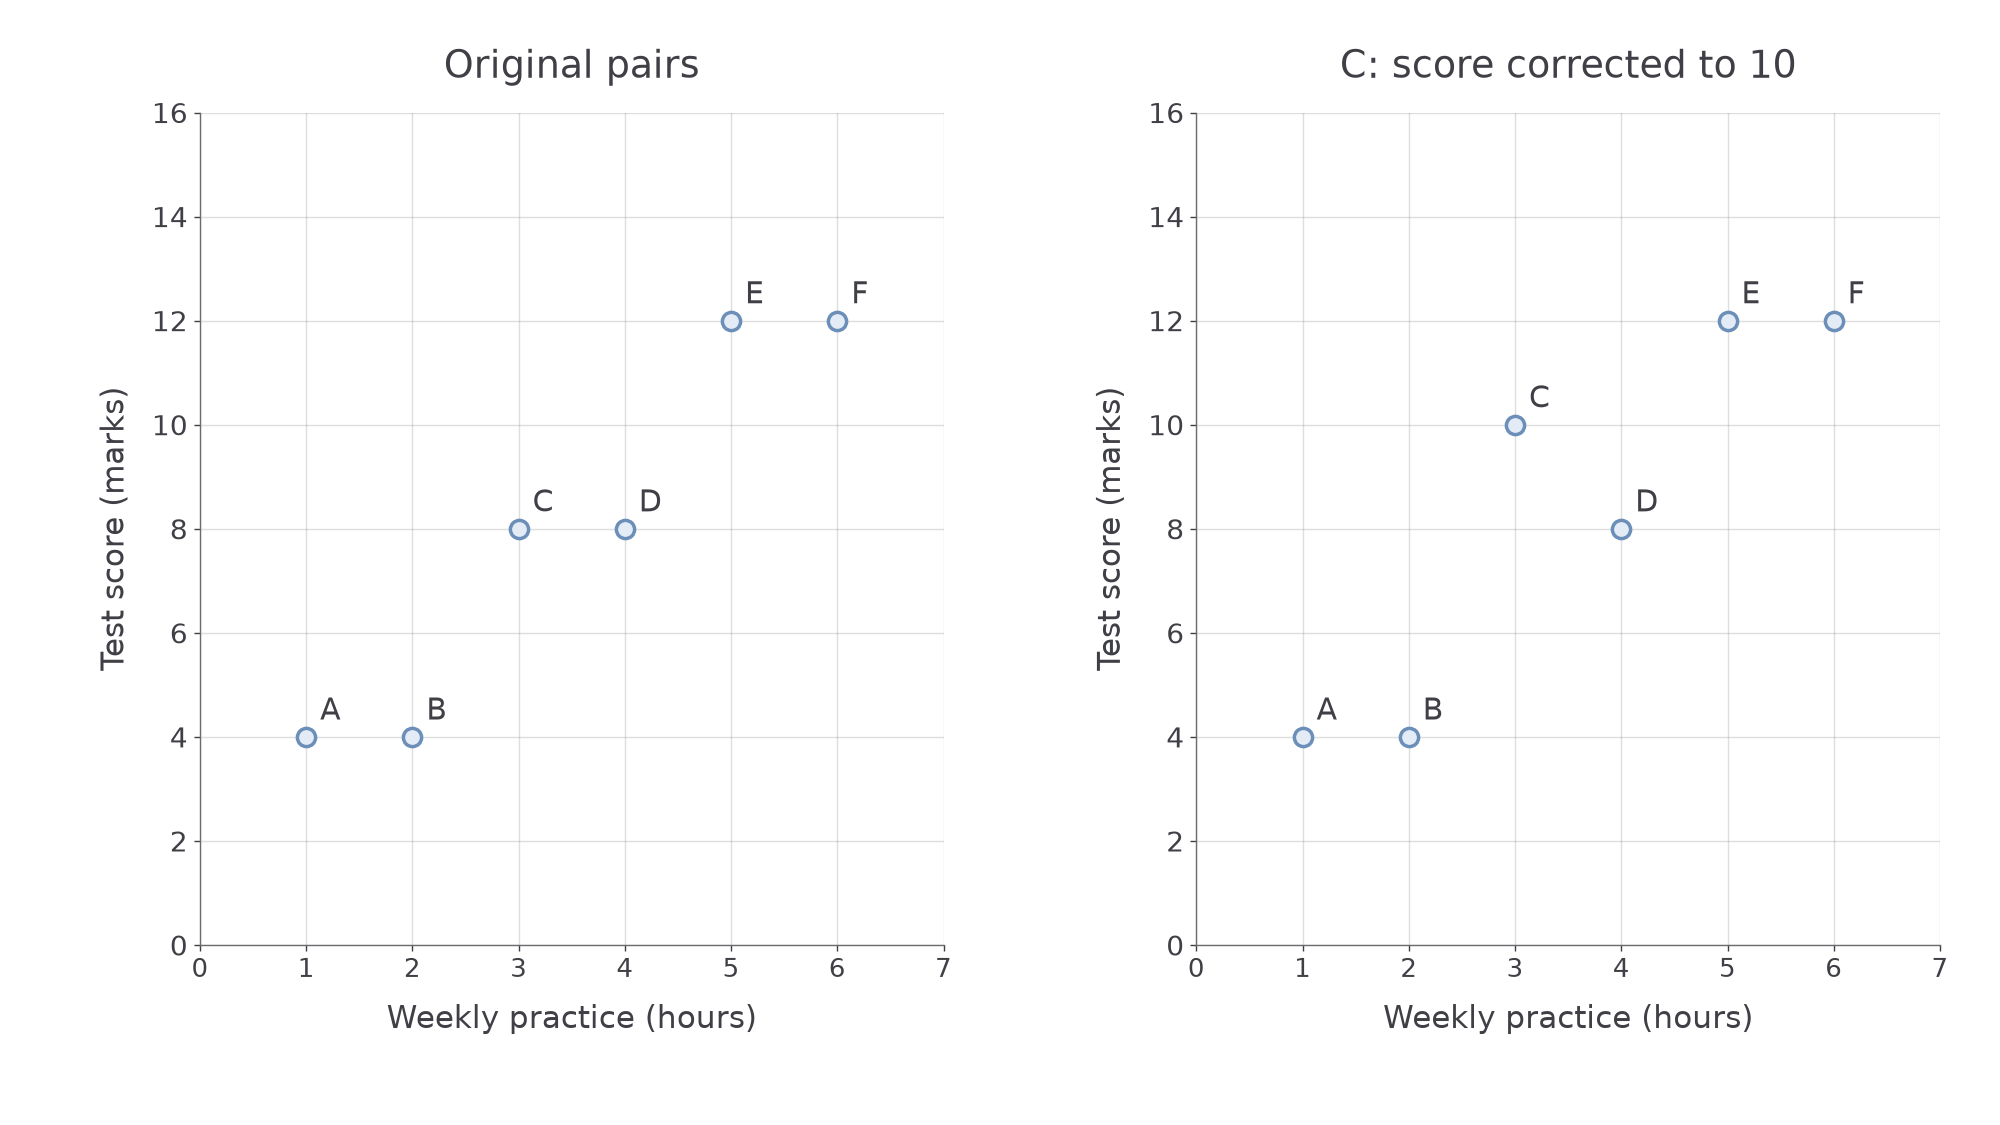
For example, use weekly practice time in hours horizontally and test score in marks vertically. The following six observations belong to six pupils.
| Pupil | A | B | C | D | E | F |
|---|---|---|---|---|---|---|
| Practice time, hours | 1 | 2 | 3 | 4 | 5 | 6 |
| Test score, marks | 4 | 4 | 8 | 8 | 12 | 12 |
[DIAGRAM: asset_name: Keeping paired observations together; asset_slug: plotting-paired-data; caption: Each point belongs to one pupil. Correcting C's score changes only its vertical coordinate.; description: Two scatter graphs show the six practice-time and test-score pairs from the table. In the second graph only C moves from 3,8 to 3,10. Axes and the other five points stay fixed.]
Worked example 1: placing one pupil
Question. State C's plotted coordinate and explain how to locate it.
Plan. Read both measurements from C's column, keeping the axis order.
Answer. Move to 3 on the horizontal axis and 8 on the vertical axis; plot .
Check. Reading back from the point gives the two measurements in C's column, not another pupil's score.
Change only C's score, correcting it from 8 to 10 marks.
Worked example 2: correcting one measurement
Question. Give C's corrected coordinate and describe its movement.
Plan. Retain the practice time and replace the score.
Answer. C moves vertically upwards to ; it does not move horizontally.
Check. The practice time remains 3 hours, while the score increases by exactly 2 marks.
We will use the original six pairs again later, without this correction. Repeated horizontal values are allowed: two pupils can practise for the same time and achieve different scores. Identical pairs occupy the same point, so a graph may need a note to show repeated observations.
Watch out
Do not sort the two variable lists separately. That destroys the original pairs and can create a relationship that the data did not contain.
Keep the axis order in this new setting.
Direction and strength of correlation
Correlation describes a pattern across many pairs, rather than a rule that every point must obey.
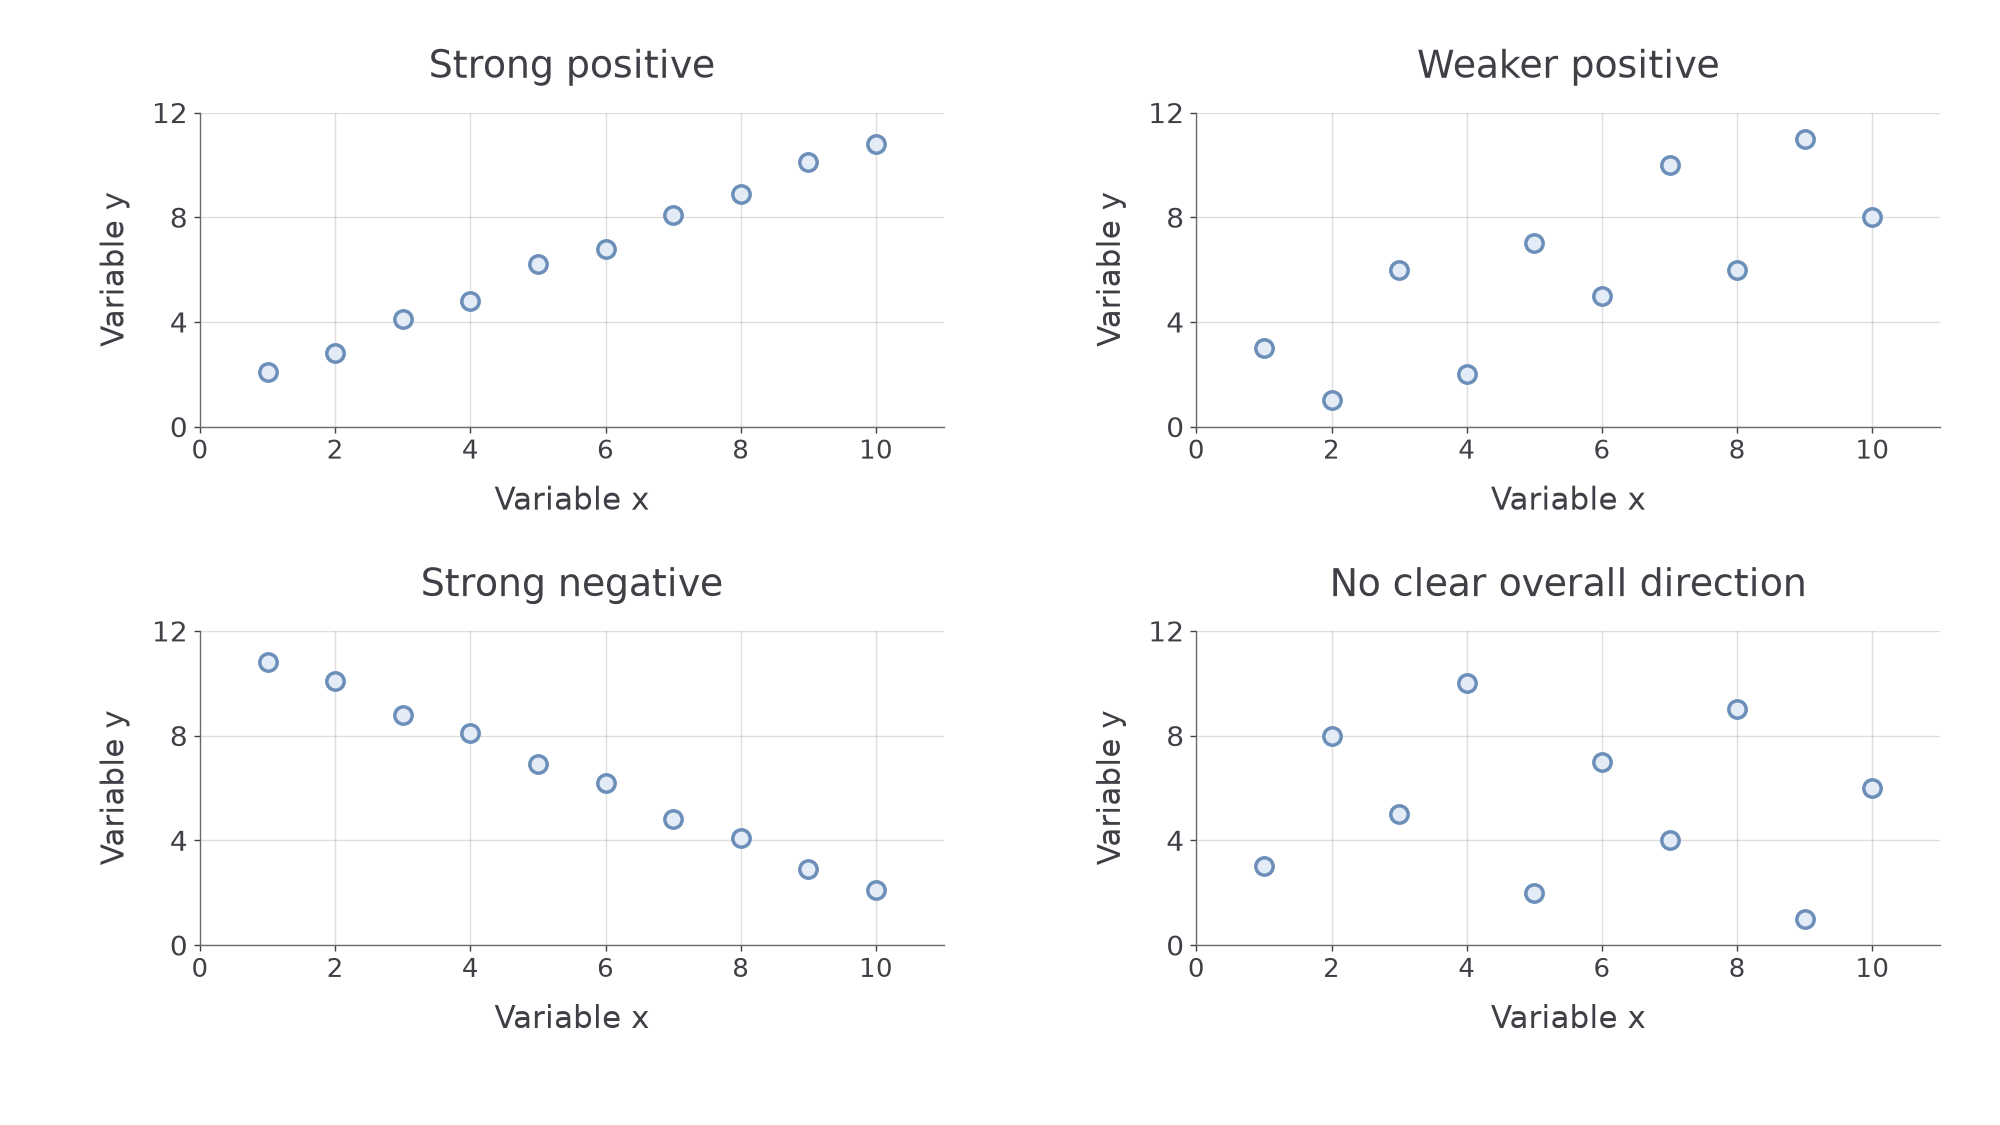
With positive correlation, larger values of one variable tend to accompany larger values of the other. With negative correlation, larger values of one tend to accompany smaller values of the other. No clear correlation means the graph shows no clear overall increasing or decreasing association. Do not infer a pattern from one or two points alone.
[DIAGRAM: asset_name: Direction and strength in scatter diagrams; asset_slug: correlation-patterns; caption: Direction describes rising or falling association. Strength describes how closely points follow the pattern.; description: Four scatter panels show strong positive, weaker positive, strong negative and no clear increasing or decreasing association. Each panel uses the same axis scales so the point patterns can be compared.]
Correlation and causation
Correlation is an association between variables. Causation means a change in one variable produces a change in another. Correlation alone does not establish causation.
An association is stronger when points lie more closely around its trend, and weaker when they are more scattered. Steepness is not strength: changing the units on an axis changes the apparent steepness without changing the paired observations. A nearly horizontal narrow cloud can show a strong association if the variation is clear on appropriate scales. A U-shaped pattern can show a relationship without a single increasing or decreasing trend.
Interpret the variables, not just the slope. For car age and resale value, a downward pattern means older cars tend to have lower values; it does not mean every older car is cheaper. If ice-cream sales and sunburn cases rose together in a made-up summer record, hotter sunny weather could influence both. Buying ice cream would not thereby be shown to cause sunburn.
In the practice-and-score example, a positive association could also reflect prior knowledge, motivation or other factors. A scatter graph alone cannot separate those explanations. “Tend to” allows for individual variation while stating the pattern clearly.
Key idea
Describe direction, strength where clear, and the contextual meaning. Keep the claim about association separate from any proposed explanation.
Choose the conclusion supported by the stated pattern.
Lines of best fit
A line of best fit summarises a roughly straight association without trying to pass through every observation.
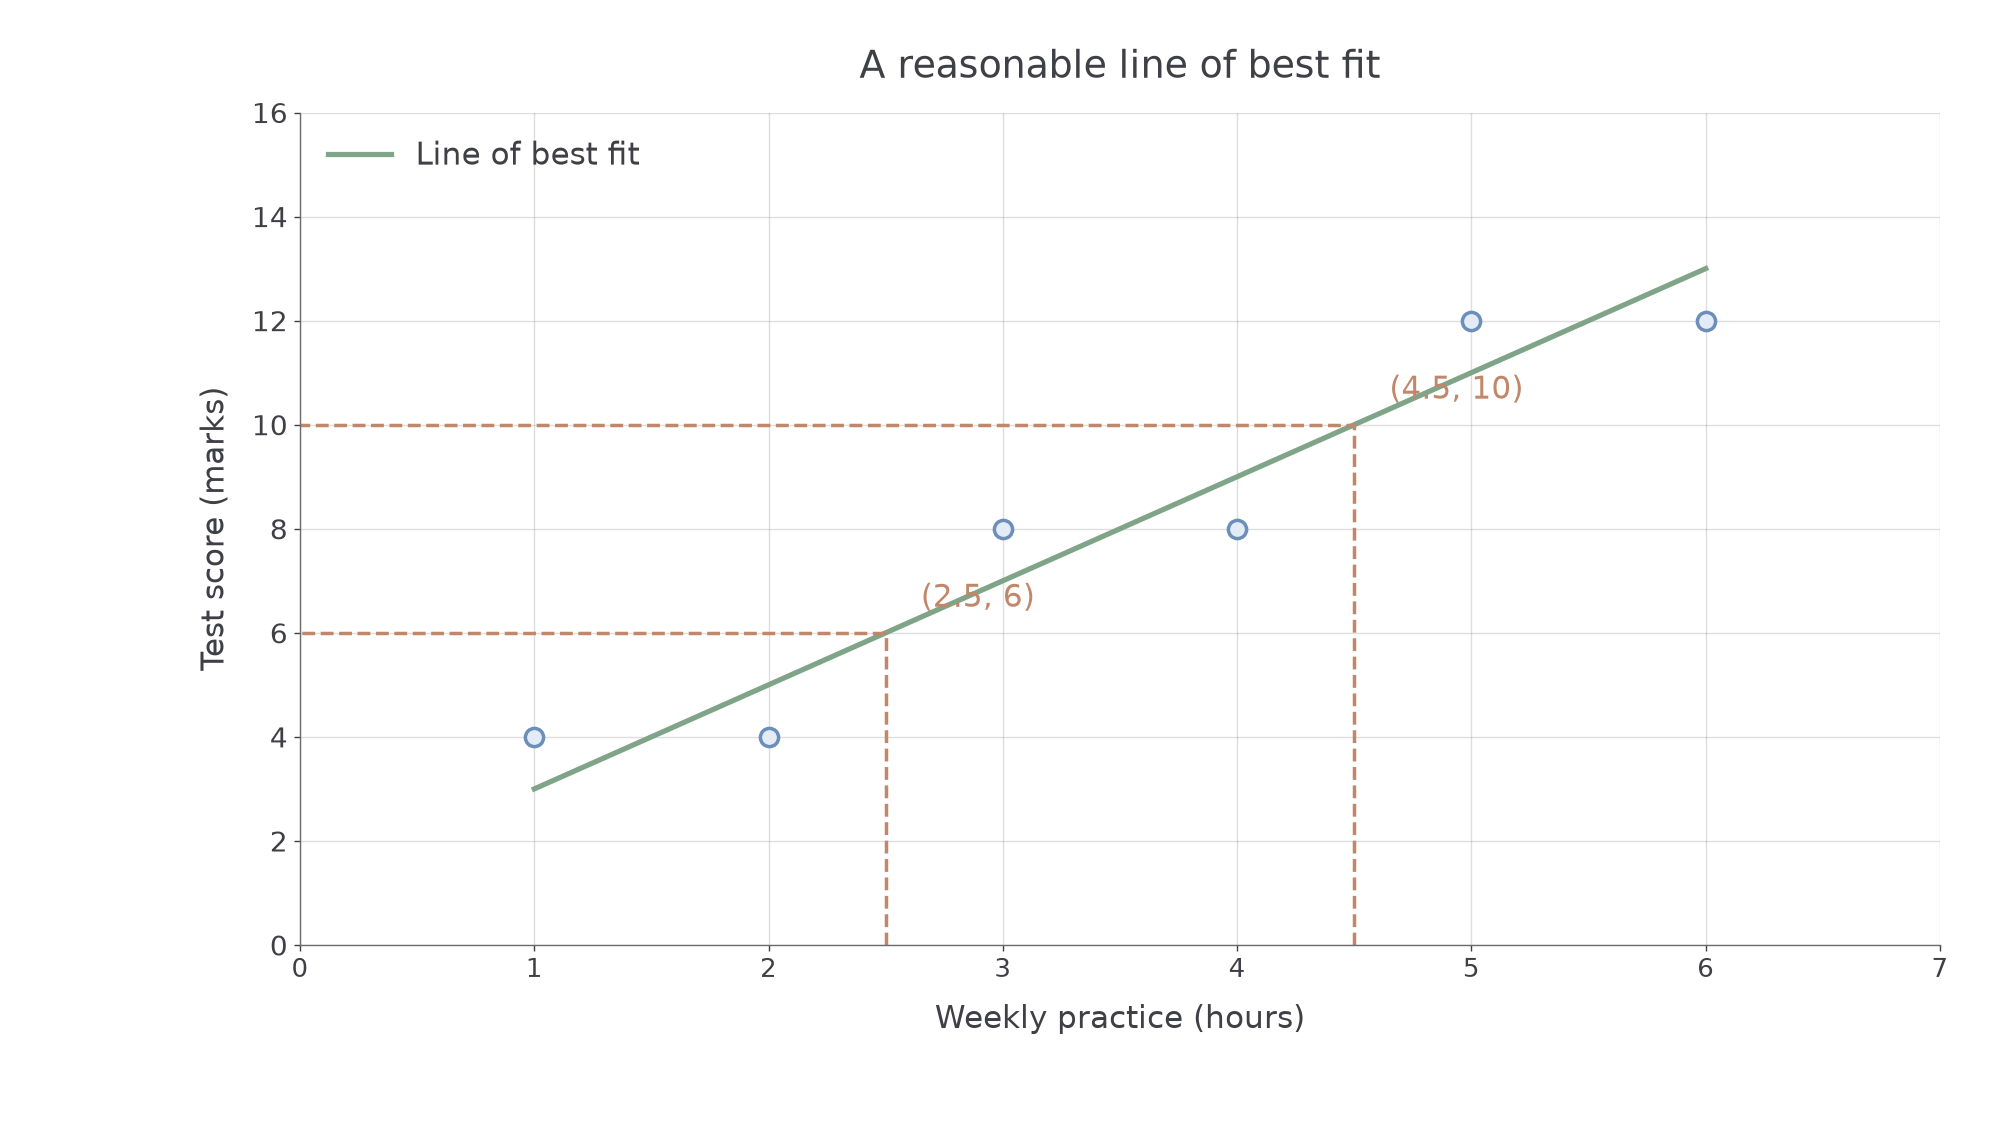
Draw a straight ruled line through the middle of the point cloud, following its direction, with a reasonable balance of points above and below along its length. It need not pass through any particular point or through the origin. Do not join the dots or simply connect the first and last points. Different reasonable lines drawn by eye can give slightly different predictions.
If there is no useful approximately linear trend, a straight line gives little basis for prediction. Investigate an unusual point before letting it pull the line away from the main pattern; do not erase a genuine observation just to improve the appearance of a line.
[DIAGRAM: asset_name: A line through the middle of a scatter pattern; asset_slug: best-fit-line; caption: This reasonable line balances the original six points above and below it. Predictions are read from the line.; description: The original six practice-score points are plotted with a straight best-fit line passing through 1,3 and 6,13. Dashed guides show predictions at 2.5 hours and 4.5 hours, giving 6 and 10 marks. The line is a by-eye model, not a join of the observations.]
Worked example 3: reading a fitted line
Question. A reasonable line of best fit for the original six practice-score points passes through and . Estimate the score for 2.5 hours of practice.
Plan. Read from 2.5 hours to the fitted line, then across to the score axis; use the line's rate as a numerical check.
Answer. About 6 marks.
Check. The line predicts 5 marks at 2 hours and 7 at 3 hours. At 2.5 hours its prediction should be halfway between, at 6.
Change only the requested practice time, keeping the same fitted line.
Worked example 4: another prediction from the same model
Question. Use the same line to estimate the score for 4.5 hours.
Plan. Read at the new horizontal coordinate without changing the line to fit that request.
Answer. About 10 marks.
Check. Increasing the input from 2.5 to 4.5 hours adds 2 hours. The line's predicted score rises by , from 6 to 10.
Continue this lesson.
You’re previewing NovaLearn without an account. Create a free account to read the rest.
Create free account