11.02c, 11.02e - Sets, Venn diagrams and addition
If 18 students play football and 14 make music, must there be 32 different students? Under 11.02c you will describe sets and use Venn diagrams to keep overlapping groups separate. Under 11.02e you will calculate probabilities of “not”, “or” and “both” without counting anybody twice.
Describing sets
A set is a collection with a clear membership rule. For example, lists three members, while “the even integers from 1 to 6” describes the same set. Order does not matter, and writing a member twice does not add a new member.
Set descriptions
Curly brackets enclose a set. A description such as means “the set of values such that the stated conditions hold”. The vertical bar means such that. The universal set is the complete collection being considered.
State the number type when it affects membership. Integers in an interval can be listed; all real numbers in that interval usually cannot be listed one by one.
Worked example 1: listing an integer set
Question. List .
Plan. Read both strict boundaries, then list each integer between them once.
Answer. .
Check. Every listed number is an integer satisfying both inequalities; the next integers, and , fail a strict boundary.
Change only the upper inequality to allow equality. One new member enters.
Worked example 2: including a boundary
Question. List .
Plan. Keep the lower boundary strict and include the upper endpoint.
Answer. .
Check. The only change from is the permitted value ; is still excluded.
Sets can contain objects too: “students who cycle” is a membership rule. “The nicest students” needs an agreed criterion before it can classify people reliably. We will use the words “and”, “or” and “not” for relationships between sets; extra intersection, union and complement symbols are not needed.
Watch out
has three different members, not four. Also, does not mean only unless is restricted to integers; for real , values such as belong too.
Read both the domain and the boundaries.
Placing outcomes in Venn regions
Two properties can overlap. A Venn diagram puts all outcomes inside a rectangle representing the universal set, with a circle for each property. Someone with both properties goes in the overlap once, rather than appearing in two separate regions.
The four Venn regions
For sets and , the four separate regions are: only, both and , only, and neither. “ or ” includes the overlap. “Exactly one” excludes the overlap.
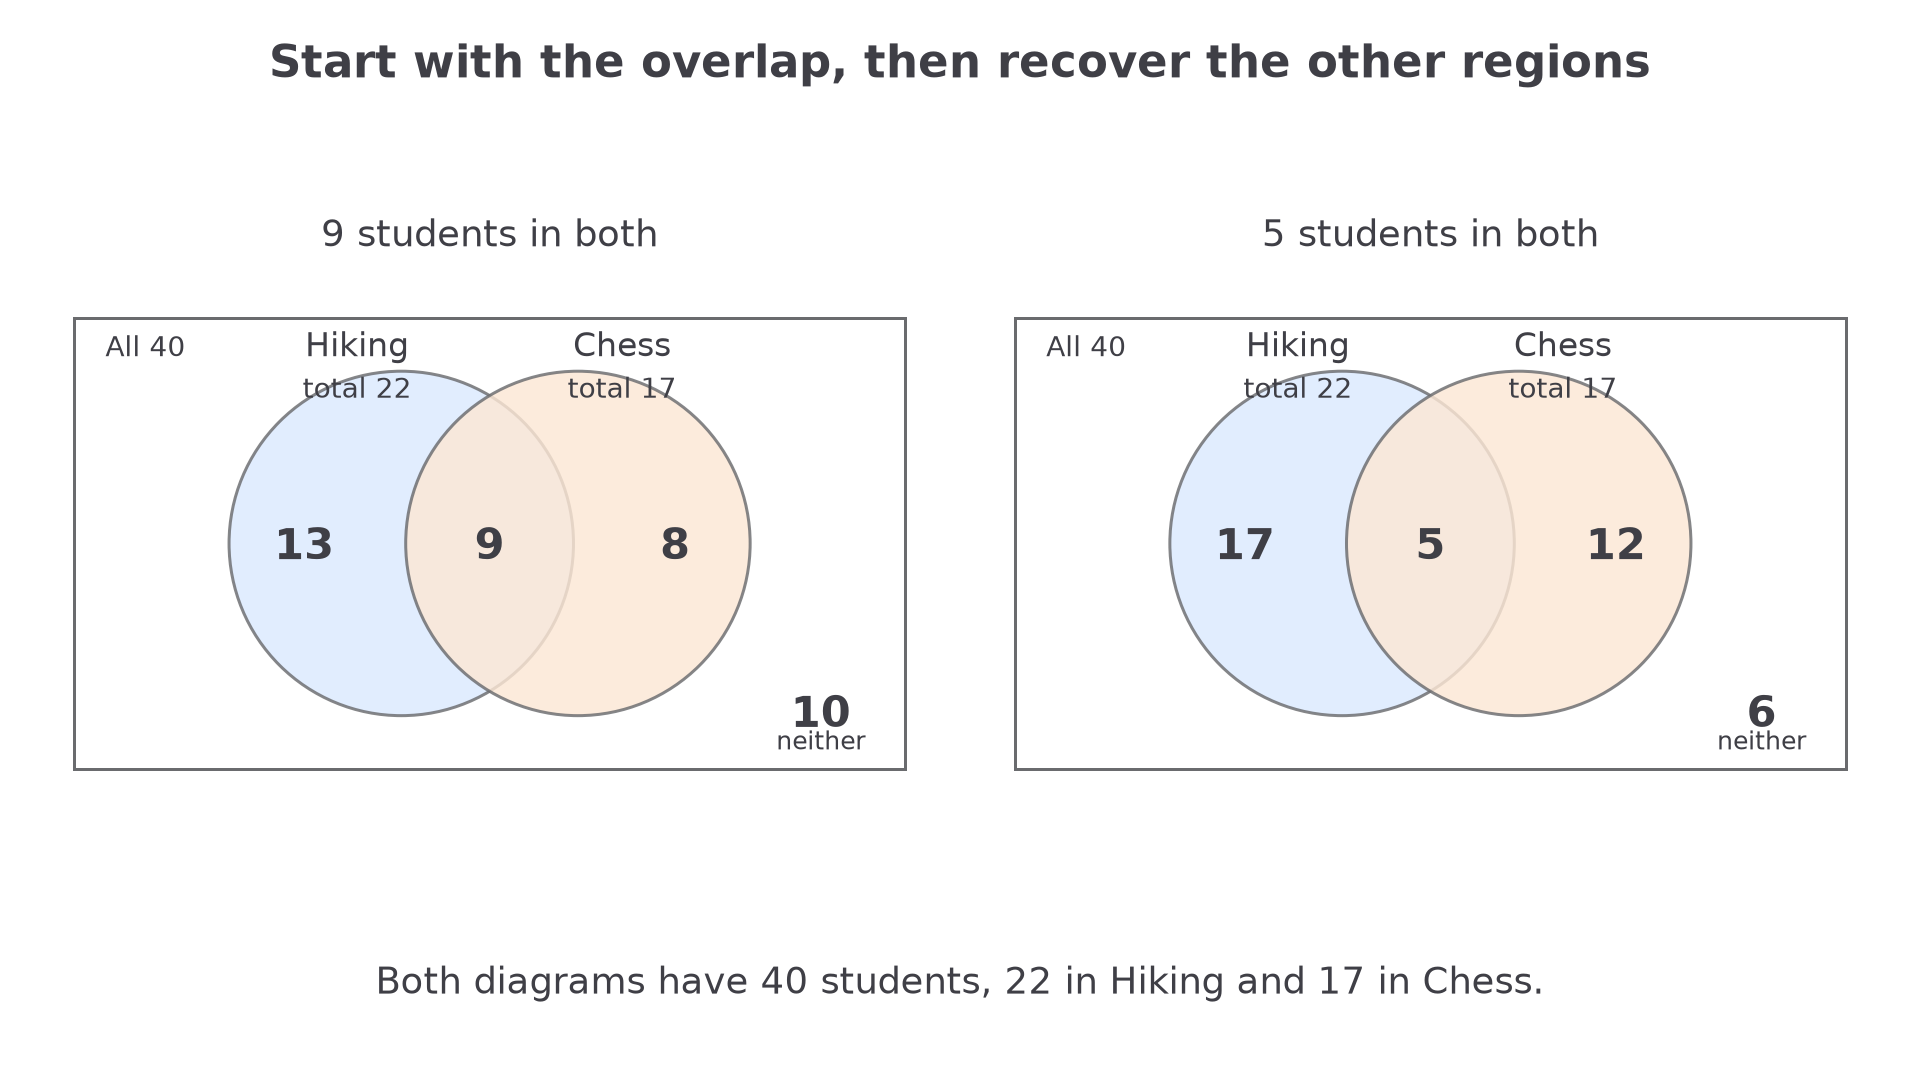
To construct the diagram, draw the rectangle and two labelled overlapping circles. Enter the overlap first, subtract it from each circle total, then use the overall total to find neither.
[DIAGRAM: asset_name: Filling two-circle Venn diagrams; asset_slug: venn-count-regions; caption: A circle total includes its overlap.; description: Two labelled Venn diagrams for forty students. Both have H total 22 and C total 17. The first has H-only 13, both 9, C-only 8 and neither 10. The second has H-only 17, both 5, C-only 12 and neither 6. All four regions lie inside each universal rectangle.]
Worked example 3: working from totals
Question. Of students, like hiking, like chess and like both. Find all four Venn-region counts and the probability that a randomly chosen student likes exactly one activity.
Plan. Put the nine shared students in first, then subtract them from each group total.
Answer. The regions are ; the probability is .
Check. The four regions total , while the circle totals reconstruct and .
Keep the total and both circle totals unchanged, but reduce the overlap to five. Fewer shared members mean more different people inside the circles.
Worked example 4: changing the overlap
Question. There are again students, liking hiking and liking chess, but now like both. Find the regions and the probability of exactly one activity.
Plan. Subtract the new overlap from each unchanged circle total.
Answer. The regions are ; the probability is .
Check. , and both original circle totals still hold.
A diagram can contain individual outcomes instead of counts. For numbers –, “even” and “multiple of 3” place in both, in even only, in multiple-of-3 only, and outside both. The same four-region logic applies.
Watch out
Do not put into the hiking-only region when is the whole hiking total. If your four regions exceed the universal total, check for a duplicated overlap. Negative region counts signal inconsistent data or an error.
Give the new region counts in words; you do not need a drawing tool.
Events that do not happen
A parcel either arrives on time or does not. These two possibilities cover everything and cannot happen together. This makes “not” especially useful when an event has many possible outcomes.
Complement rule
For any event ,
An event and its complement have no shared outcomes and together cover the whole sample space. Not separately printed on the 2027 formula sheet: learn this rule.
The complement may be a collection of several named outcomes. “Not red” can include blue, green and any other colours, rather than meaning blue alone.
Continue this lesson.
You’re previewing NovaLearn without an account. Create a free account to read the rest.
Create free account