6.3.2(b) - Proton NMR spectroscopy
Proton NMR spectroscopy lets you use hydrogen atoms as labels inside an organic molecule. In this lesson you will learn how to analyse a high-resolution proton NMR spectrum to predict proton environments, use chemical shift and integration data, apply the n + 1 splitting rule, and build possible structures from the evidence.
Read the spectrum in a fixed order
A high-resolution proton NMR spectrum is a graph of absorption against chemical shift, usually written as δ / ppm. The axis is normally shown with larger chemical shift values on the left and smaller values on the right. In a well-resolved simple spectrum, each signal or split group comes from one set of equivalent protons. Different signals can overlap: a broad aromatic multiplet can contain several non-equivalent ring environments. Do not infer that all five H in an aromatic cluster are equivalent.
Use the same order every time:
- Count the signals to find the number of proton environments.
- Use chemical shift values to suggest the type of proton environment.
- Use integration traces or ratio numbers to find the relative number of protons in each environment.
- Use splitting patterns to find how many adjacent non-equivalent protons are nearby.
- Combine the fragments into a possible structure.
The key discipline is not to jump straight from one peak to a final structure. A single signal might suggest a fragment, but the final structure must fit the signal count, chemical shifts, integrations and splitting patterns together.
Count proton environments
Two protons are equivalent if they are in the same chemical environment and would give the same proton NMR signal. Equivalent protons are often related by symmetry or by rapid rotation around single bonds. Non-equivalent protons are in different surroundings and give different signals.
The number of protons is not the same as the number of proton environments. For example, all six protons in CH₃COCH₃ are equivalent, so propanone gives one proton NMR signal even though it contains six hydrogen atoms. In CH₃CH₂COCH₃, the terminal CH₃, the middle CH₂ and the CH₃ next to the carbonyl group are in three different environments, so three signals are expected.
When counting environments, ask:
- Are the protons attached to the same carbon and in the same surroundings?
- Is there symmetry that makes two groups equivalent?
- Are the protons next to different functional groups or different parts of a chain?
Worked example: CH₃CH₂OCH₂CH₃ has two proton environments, not four. The two CH₃ groups are equivalent to each other, and the two CH₂ groups are equivalent to each other.
Use chemical shift to identify environment type
Chemical shift tells you about the electronic surroundings of the proton environment. Protons near electronegative atoms, carbonyl groups, alkene groups or aromatic rings are often shifted to larger δ values because they are in a different magnetic environment from simple alkyl protons.
In examinations, proton NMR chemical shift values are provided on the data sheet. You should learn how to use the table, not memorise every range. A useful first pass is:
- about 0.5-2 ppm: alkyl protons such as
- about 2-3 ppm: protons next to groups such as , aromatic rings or nitrogen-containing environments
- about 3-4.3 ppm: protons next to electronegative atoms such as oxygen or halogens
- about 4.5-6 ppm: alkene protons
- about 6.2-8 ppm: aromatic protons
- about 9-10 ppm: aldehyde protons
- about 10-12 ppm: acidic protons, especially in carboxylic acids
These are guide regions. Chemical shifts can vary with solvent, concentration and substituents, so a value just outside a neat box is not automatically wrong. The data sheet also warns that and shifts are very variable and are often broad; their signals are not usually seen as split peaks.
OCR has one important aromatic boundary here: you may be expected to identify aromatic protons from chemical shift values, but you are not expected to analyse their splitting patterns. If a signal is in the aromatic region, use it as evidence for an aromatic environment, but do not try to count adjacent aromatic protons from the multiplet.
Chemical-shift ranges are guides, not unique identities. A proton on carbon between two shifting groups may lie further downfield than either simple range suggests. For example, the CH in C₆H₅CH(CH₃)CHO is next to both an aromatic ring and an aldehyde group, so a signal near 3.8 ppm need not imply C–O. Check the molecular formula, IR carbonyl evidence and the other proton signals before assigning oxygen connectivity.
Worked example: a signal at δ = 7.2 ppm with integration 5H strongly suggests five aromatic protons. A signal at δ = 3.9 ppm suggests protons on carbon next to oxygen, chlorine or bromine. A signal at δ = 1.1 ppm suggests alkyl protons away from strongly shifting groups.
Use integration to count relative protons
[DIAGRAM: asset_name: 6.3.2b - Proton NMR spectroscopy - diagram 01; asset_slug: 06_03_02b_proton_nmr_spectroscopy__diagram_01; recommended_method: drawn_chem; description: Ethyl ethanoate simulated proton spectrum with 2H quartet, 3H singlet, 3H triplet and quantitative integral steps.]
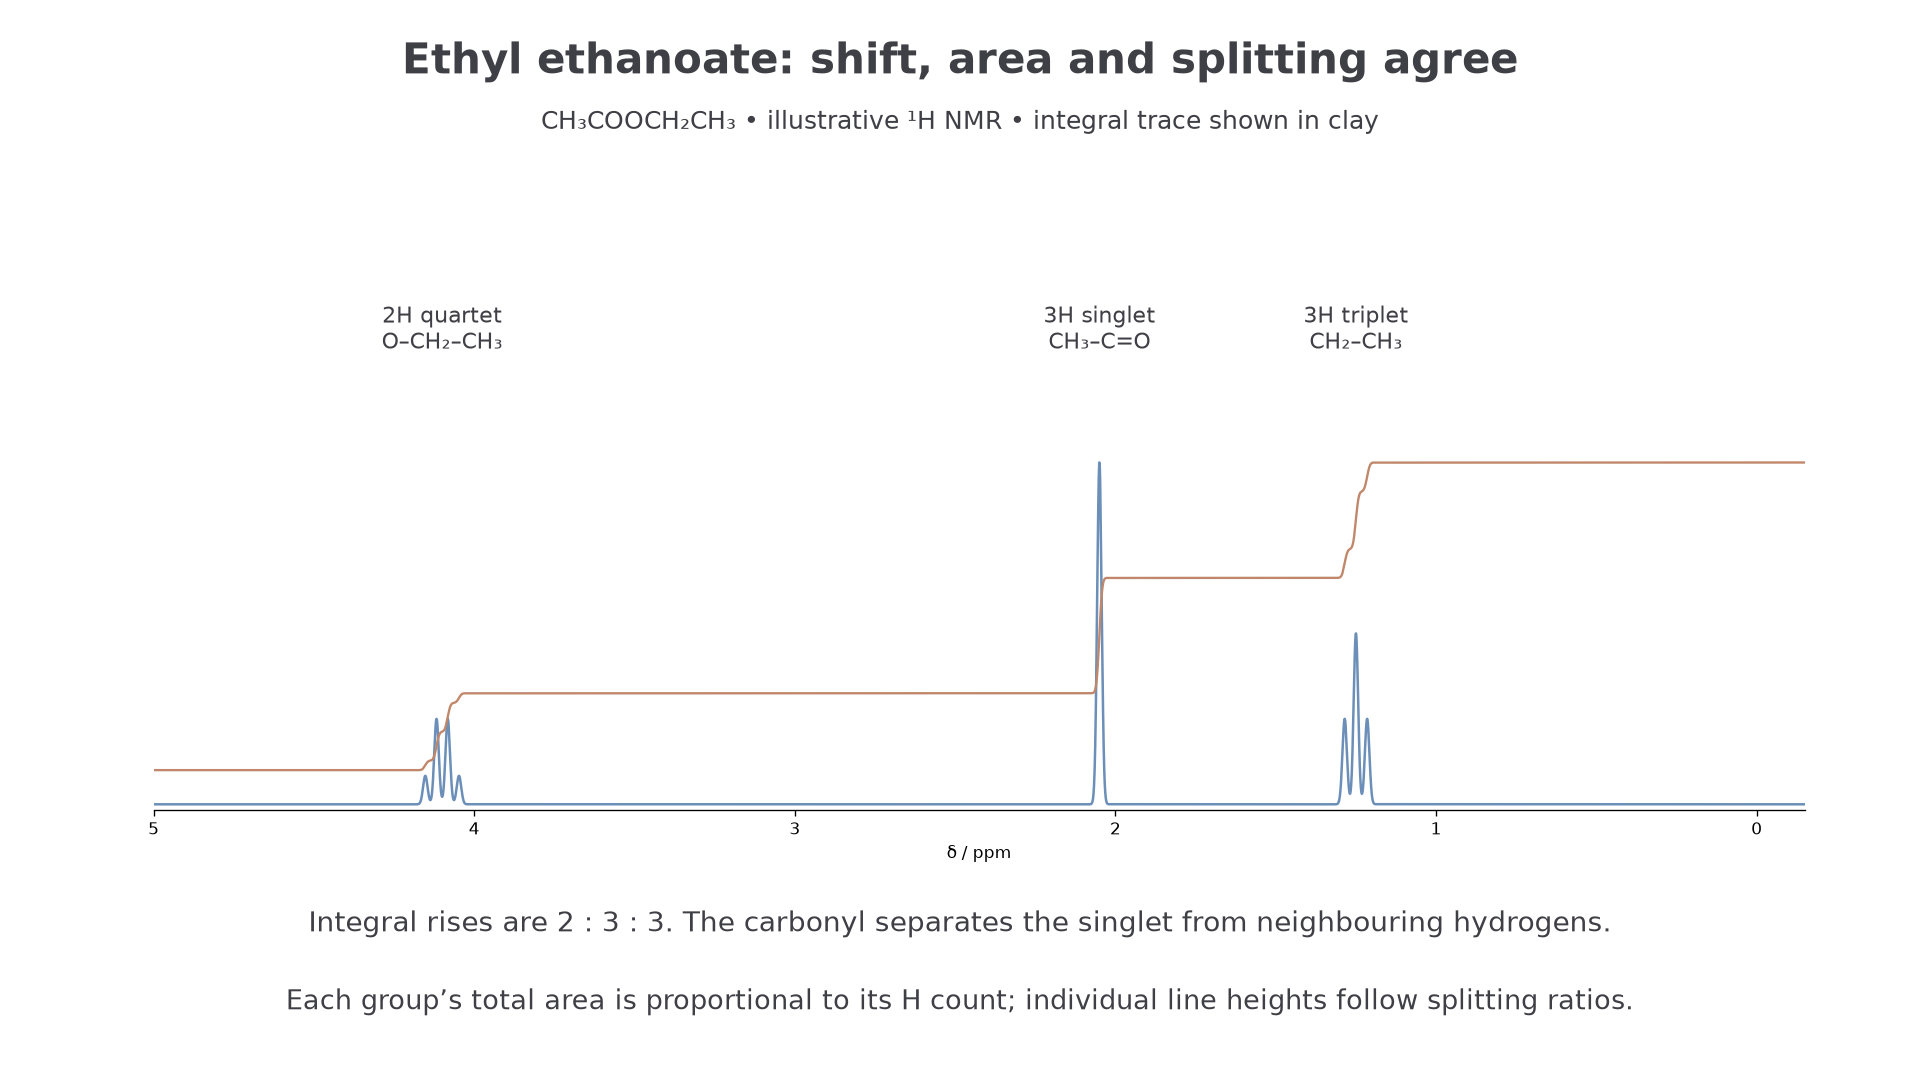
Integration measures the area under a signal cluster, not the height of the tallest line. A larger area means more protons in that environment. Integration may be shown as a stepped trace or as ratio numbers beside the peaks.
Integration
Integration is the relative area under proton NMR signals. It gives the relative number of protons responsible for each signal.
On a stepped integration trace, measure the vertical rise across each whole signal cluster, not its absolute height on the page. Rises of 12 mm, 18 mm and 18 mm give 2:3:3 even if the trace starts above zero. Splitting spreads one environment across several lines; integrate all of them together.
Continue this lesson.
You’re previewing NovaLearn without an account. Create a free account to read the rest.
Create free account