3.2.1(a)-(d) - Enthalpy profiles and standard enthalpy changes
Chemical reactions often transfer energy between the reacting chemicals and their surroundings. In this lesson you will learn how to decide whether an enthalpy change is exothermic or endothermic, how to read and construct enthalpy profile diagrams, and how to use the key thermochemistry definitions accurately.
Enthalpy change and sign
Enthalpy, H, is a way of representing the chemical energy of substances at constant pressure. An enthalpy change, , compares the enthalpy of the products with the enthalpy of the reactants for a reaction.
Reaction enthalpy difference
The sign tells you the direction of energy transfer for the reacting chemicals, which are often called the system.
- In an exothermic reaction, the reacting chemicals transfer energy to the surroundings. The products have lower enthalpy than the reactants, so is negative.
- In an endothermic reaction, the reacting chemicals take in energy from the surroundings. The products have higher enthalpy than the reactants, so is positive.
Exothermic reaction
An exothermic reaction has a negative enthalpy change because the products have lower enthalpy than the reactants.
Endothermic reaction
An endothermic reaction has a positive enthalpy change because the products have higher enthalpy than the reactants.
The sign belongs to the reaction, not just to a thermometer reading. For example, if a reaction warms the surroundings, the surroundings have gained energy, so the reacting chemicals have lost energy and the reaction is exothermic.
Worked example: deciding the sign
A reaction has reactants at a relative enthalpy of +40 kJ mol⁻¹ and products at a relative enthalpy of -110 kJ mol⁻¹ on the same scale.
Use the enthalpy difference:
The products are lower than the reactants, so the reaction is exothermic. The negative sign is not added afterwards as a label; it follows from comparing product and reactant enthalpies.
Enthalpy profile diagrams
An enthalpy profile diagram shows how the enthalpy of the reacting system changes as a reaction progresses. It is a qualitative energy picture, not a drawing of molecules moving through space.
[DIAGRAM: asset_name: Lesson 3.2.1a-d: Enthalpy Profiles, Activation Energy and Definitions - diagram 01; asset_slug: 03_02_01a_enthalpy_profiles_activation_energy_and_definitions__diagram_01; recommended_method: drawn_chem; description: A clean 16:9 paired enthalpy profile diagram for exothermic and endothermic reactions with enthalpy on the y-axis, progress of reaction on the x-axis, reactant/product levels, a hump to the transition-state maximum, Delta H arrows showing negative and positive signs, and activation energy arrows measured from reactants to the peak.]
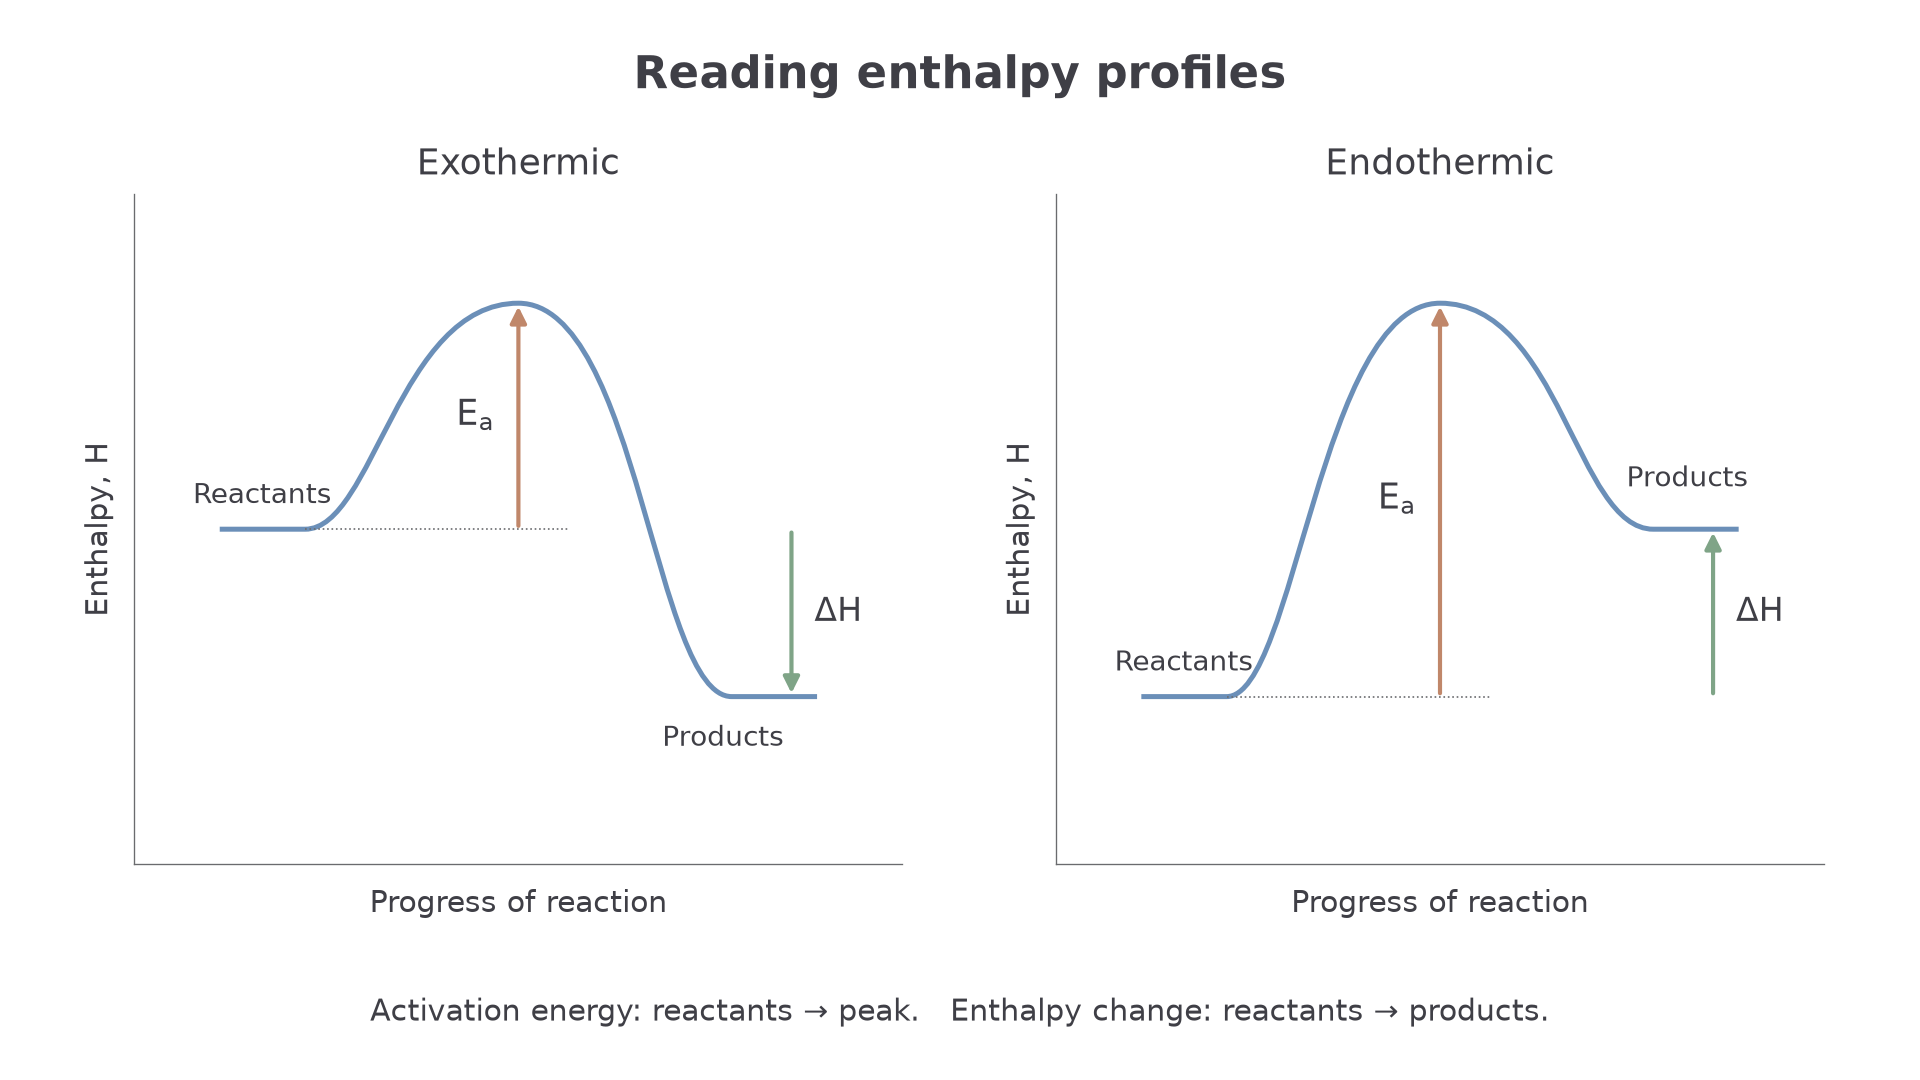
To construct a simple enthalpy profile:
- Put enthalpy, H on the vertical axis.
- Put progress of reaction on the horizontal axis.
- Draw the reactants as a horizontal level.
- Draw the products lower for an exothermic reaction, or higher for an endothermic reaction.
- Draw a curve with a hump between reactants and products.
- Show as the vertical difference between the reactant and product levels.
For an exothermic reaction, the arrow points down from reactants to products and the value is negative. For an endothermic reaction, the arrow points up from reactants to products and the value is positive.
Worked example: constructing the profile from words
For the reaction:
the enthalpy change is negative. This means the product level for H₂O(l) must be below the reactant level for H₂(g) + O₂(g). The curve still rises to a maximum before falling to the product level, because particles must pass through a high-energy arrangement during the reaction.
The label belongs between the reactant and product levels. It does not measure from the reactant level to the top of the curve.
To decide exothermic or endothermic from a profile, compare reactant and product levels. Do not use the height of the hump for the sign of .
Activation energy
Even an exothermic reaction does not usually happen just because the products are lower in enthalpy. Reacting particles need enough energy to get over an energy barrier before products can form.
Activation energy
Activation energy, , is the minimum energy required for a reaction to take place.
On an enthalpy profile, activation energy is shown from the reactant level to the highest point of the curve. That highest point represents the energy barrier for the reaction pathway.
Activation energy and enthalpy change are different quantities:
- is measured from reactants to the peak.
- is measured from reactants to products.
- is about whether particles can react.
- is about the overall enthalpy difference between reactants and products.
Continue this lesson.
You’re previewing NovaLearn without an account. Create a free account to read the rest.
Create free account