5.1.1(j)-(k) - Arrhenius equation and temperature effects
Temperature changes can make a reaction seem suddenly faster or slower, even when the concentrations have not changed. In this lesson you will connect that observation to the rate constant, , and then use the Arrhenius equation to turn temperature-rate data into a straight-line graph. The goal is not to memorise the data-sheet equations, but to know how to use them accurately.
Temperature and the Rate Constant
For a reaction with a rate equation, the rate constant is the factor that links the concentrations in the rate equation to the observed rate. At a fixed temperature, is constant for that reaction. When the temperature changes, changes too.
The particle explanation comes from collision theory and Boltzmann distributions. At a higher temperature, molecules have a higher average kinetic energy. A larger proportion of molecules have energy equal to or greater than the activation energy, , so a larger proportion of collisions can lead to reaction.
That increases the reaction rate. Since the concentration terms in a rate equation may be unchanged, the increase in rate is described by an increase in the rate constant, .
Activation Energy
Activation energy, , is the minimum energy that colliding particles must have for a reaction to occur.
Worked reasoning: why changes
Suppose the same reaction mixture is warmed from 298 K to 308 K without changing the concentrations. The concentration terms in the rate equation have not changed, but the rate increases. The rate equation can only reflect that increase by a larger value of .
So the careful OCR-style chain is:
- temperature increases
- a greater proportion of molecules have energy equal to or greater than
- more collisions can lead to reaction
- rate increases
- therefore increases
Do not say that temperature lowers the activation energy. The activation energy for the uncatalysed pathway is unchanged; the energy distribution of the molecules has changed.
The Arrhenius Equation
The Arrhenius equation gives the mathematical relationship between the rate constant and temperature:
Arrhenius Equation
The symbols mean:
| Symbol | Meaning |
|---|---|
| rate constant | |
| pre-exponential factor | |
| activation energy | |
| gas constant, provided on the data sheet | |
| temperature in K |
OCR provides the equation and the gas constant on the data sheet. You still need to choose the equation correctly, substitute carefully and handle the units.
The equation contains an exponential term, . This is why does not increase in a simple straight-line way as temperature increases. As increases, increases, so becomes smaller. The exponent becomes less negative, the exponential term becomes larger, and becomes larger.
Worked example: reading the direction of change
For the same reaction, compare 300 K and 330 K. The value of is treated as constant for this Arrhenius analysis, and is the same activation energy for the reaction. At 330 K, the denominator is larger, so is less negative. Therefore is larger and is larger.
This matches the collision explanation: higher temperature gives more molecules enough energy to react, so the rate constant increases.
To compare two temperatures without knowing , divide the two expressions. For constant and :
For , warming from 300 K to 320 K gives an exponent of 1.002 and a ratio of 2.72. The units of must match ; 40.0 kJ must first become 40000 J.
Straight-Line Form
The Arrhenius equation is most useful in OCR calculations when it is rearranged into a straight-line form:
Linear Arrhenius Equation
It is clearer if you write the temperature part as :
This now matches the straight-line equation:
| Straight-line term | Arrhenius plot term |
|---|---|
| gradient, | |
| intercept, |
[DIAGRAM: asset_name: Lesson 5.1.1j-k: Arrhenius equation and temperature effects - diagram 01; asset_slug: 05_01_01e_arrhenius_equation_and_temperature_effects__diagram_01; recommended_method: drawn_chem; description: A clean 16:9 two-panel graph. Left panel shows the exponential increase of rate constant k with temperature T using k = A exp(-Ea/RT). Right panel shows a linear Arrhenius plot of ln k against 1/T with negative gradient -Ea/R and a note that the intercept ln A is at 1/T = 0.]
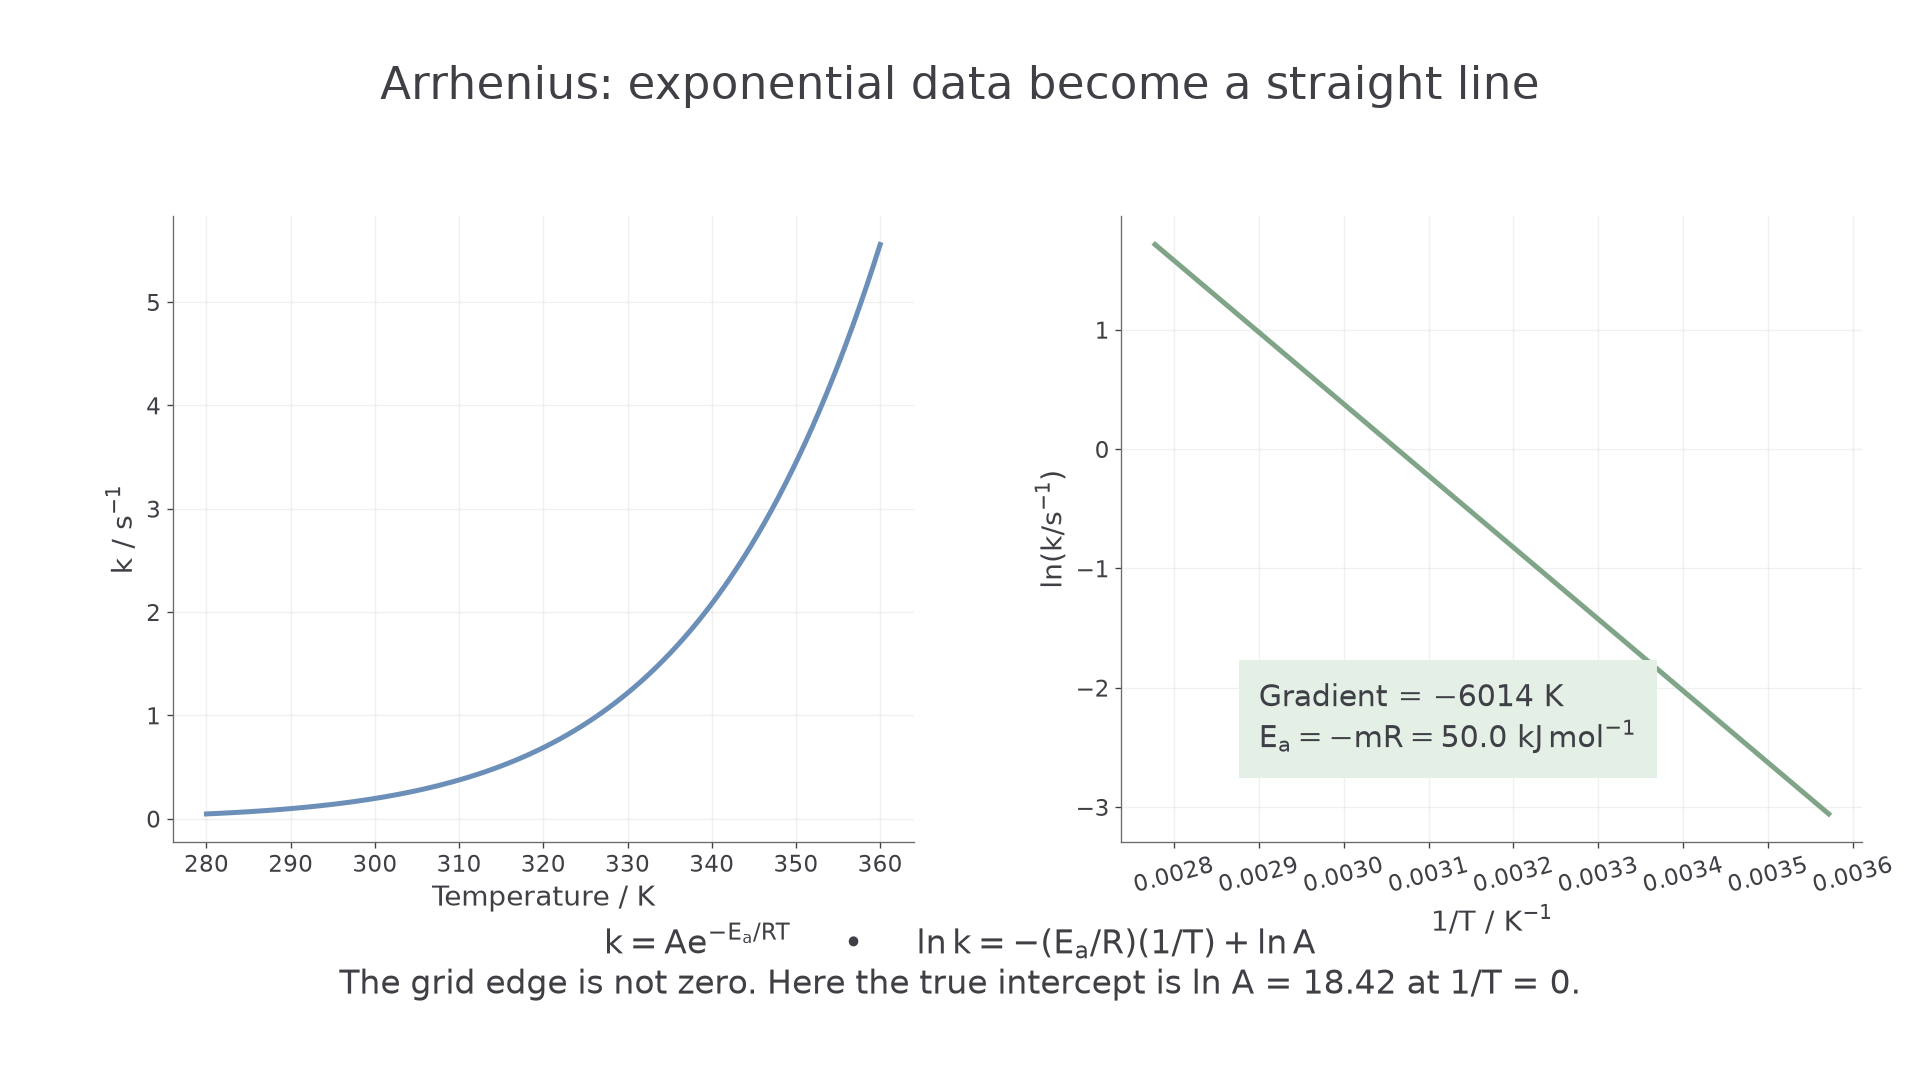
The graph of against has a negative gradient because and are both positive, so is negative. As increases, temperature is actually decreasing, so decreases.
Taking natural logarithms gives . Since , the second term is . This explains why the transformation works, rather than merely naming the graph axes.
Finding Activation Energy
Once you have the gradient of an Arrhenius plot, you can calculate the activation energy:
Rearrange:
Continue this lesson.
You’re previewing NovaLearn without an account. Create a free account to read the rest.
Create free account