6.3.1(a)-(b) - Chromatography
Chromatography is a family of analytical techniques used to separate and interpret mixtures. In this lesson, the required OCR focus is narrow and practical: one-way TLC chromatograms using values, and gas chromatograms using retention times, peak integration values, proportions and external calibration curves.
The Separation Model
Chromatography separates components because they do not all move at the same speed. Each component repeatedly distributes between two phases:
- the stationary phase, which does not move
- the mobile phase, which moves through or over the stationary phase
Stationary Phase
The stationary phase is the phase that remains fixed while the mixture is separated. In TLC this is usually a thin layer of silica or alumina on a plate.
Mobile Phase
The mobile phase is the phase that moves and carries components of the mixture. In TLC it is a solvent; in gas chromatography it is a carrier gas.
A component travels further or leaves the instrument sooner if, under those conditions, it spends more time in the mobile phase than another component. A component travels less far, or takes longer to leave, if it is retained more strongly by the stationary phase.
Silica is polar. Adsorption means attraction to its surface; a more polar solute often forms stronger dipole attractions or hydrogen bonds to silica, so with the same solvent it spends longer on the stationary phase and usually has a lower Rf. Solvent composition matters, so this is not a ranking independent of conditions.
The important exam skill is interpretation. You are not expected here to design advanced chromatographic methods. You are expected to read the evidence from a chromatogram and turn it into a conclusion about identity, purity, reaction progress, amount or concentration.
Worked reasoning: same mixture, different movements
Suppose a mixture contains two organic compounds. Compound X is more strongly attracted to the TLC solvent than to the silica surface, so X moves further up the plate. Compound Y is more strongly retained by the silica, so Y stays closer to the baseline. The chromatogram separates the mixture because X and Y have different balances of attraction to the two phases.
TLC and Rf Values
In one-way TLC, small spots of samples are placed on a pencil baseline near the bottom of a plate. The solvent rises up the plate by capillary action. When the solvent front has moved far enough, the plate is removed and the solvent front is marked before it evaporates.
[DIAGRAM: asset_name: Lesson 6.3.1a-b: Chromatography - diagram 01; asset_slug: 06_03_01a_chromatography__diagram_01; recommended_method: drawn_chem; description: One-way TLC chromatogram showing pencil baseline, solvent front, standards, sample spots, measured distances from baseline and Rf formula.]
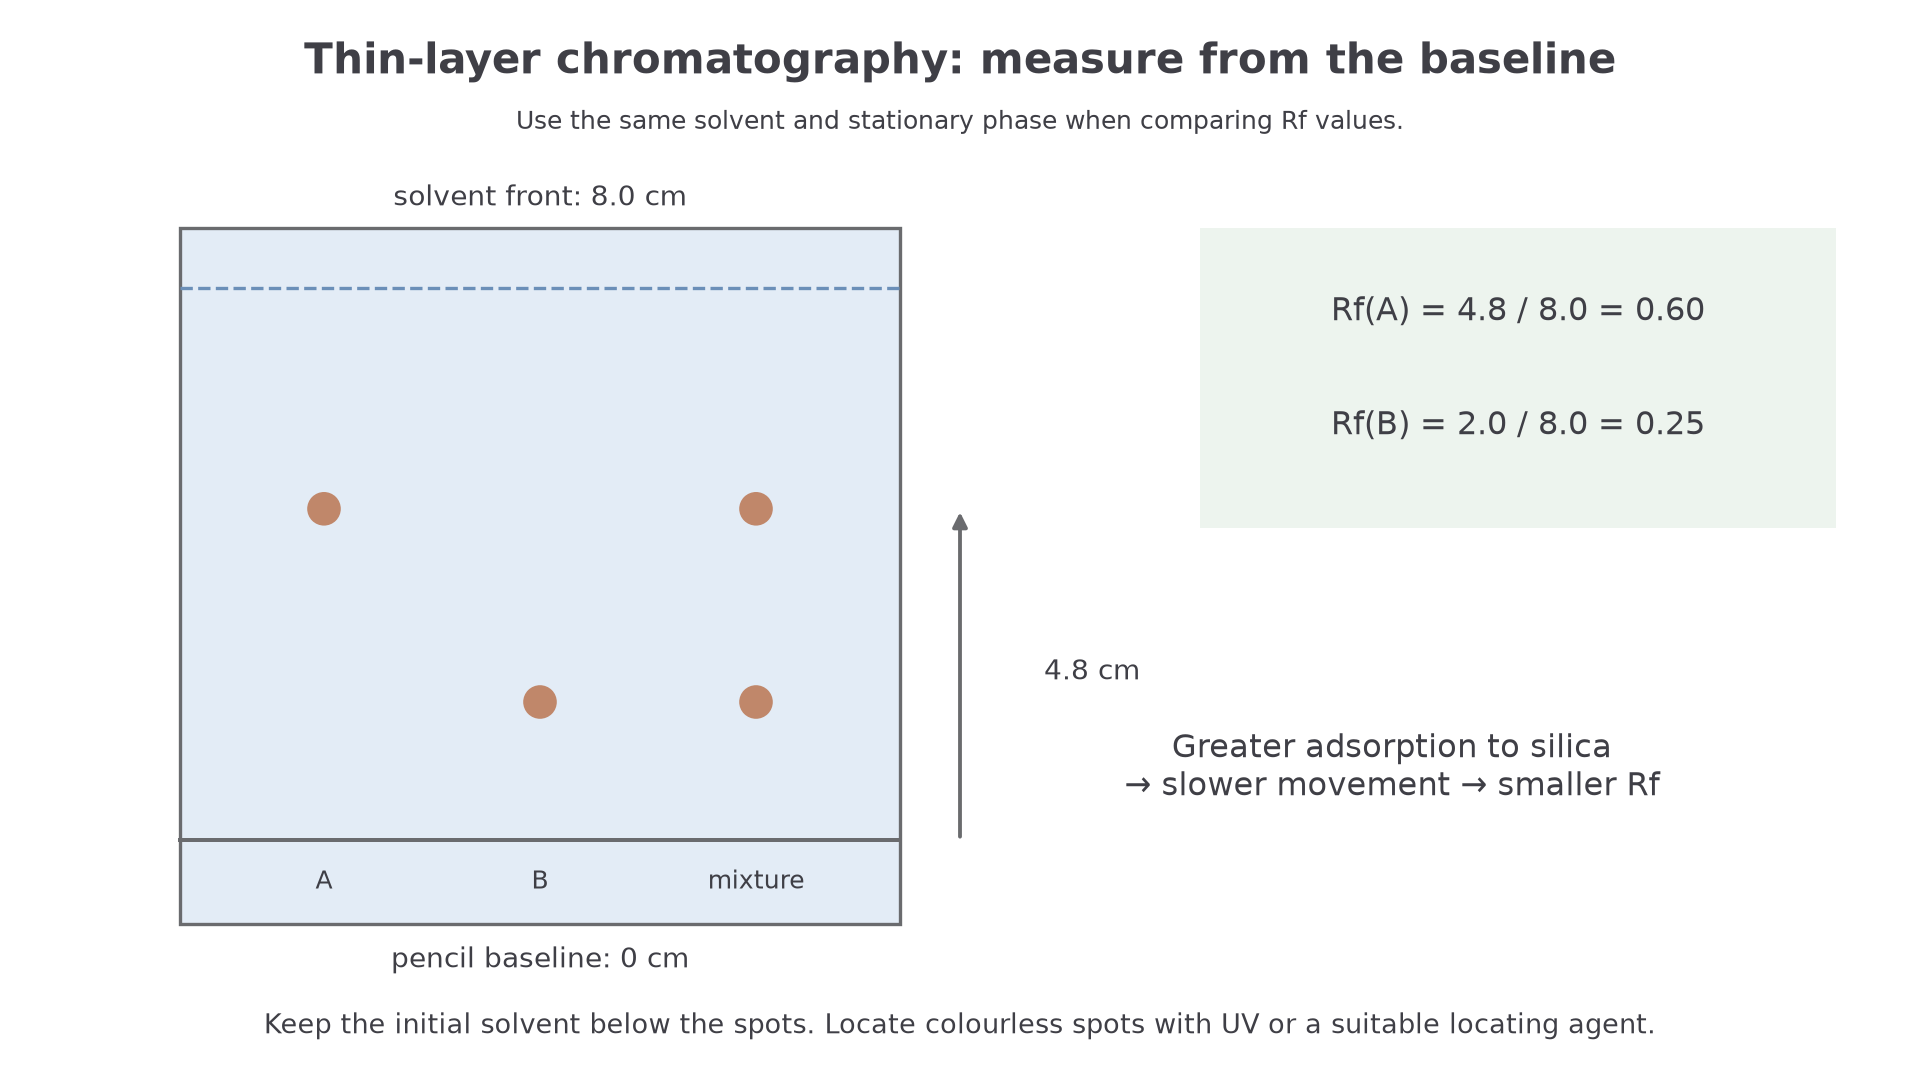
The value compares how far a component has moved with how far the solvent front has moved.
Rf Value
has no units because it is a ratio of two distances measured in the same unit. A correctly measured value should be between 0 and 1. Measure from the baseline, not from the bottom of the plate, and measure to the centre of the spot.
Worked example: calculating an value
A TLC spot moves 3.2 cm from the baseline. The solvent front moves 8.0 cm from the baseline.
The answer is 0.40, with no unit. It would be wrong to write 0.40 cm because the centimetres cancel.
For identification, compare the value of an unknown with a known standard run under the same conditions. The same compound can have different values if the solvent, stationary phase or temperature changes, so a stored number alone is weaker evidence than a side-by-side standard on the same plate.
TLC in Organic Analysis
TLC can show whether a sample is pure, whether it matches a known standard, or whether a reaction is progressing. This is why it links naturally to PAG6 organic solid synthesis: after making and purifying a solid product, TLC can help analyse the product alongside melting point evidence.
A single spot can suggest one main component, but it does not prove absolute purity. Two or more spots show a mixture. If the sample spot is at the same height as a standard spot on the same plate, the sample may contain that standard compound. If the sample has an extra spot that does not match a standard, it contains at least one additional component.
Good practical interpretation also depends on technique:
- use a pencil baseline because pencil does not dissolve and move with the solvent
- keep the solvent level below the baseline so samples do not dissolve into the solvent reservoir
- use small spots so nearby spots do not merge
- cover the chamber to reduce evaporation and allow a consistent solvent atmosphere
- mark the solvent front before it evaporates; locate colourless spots with a suitable UV lamp or locating agent, following the safety protocol
Worked reasoning: monitoring reaction progress
A reaction converts reactant R into product P. A TLC plate is run with a standard sample of P and the reaction mixture after 20 minutes. If the reaction mixture has a spot matching P and a second spot at the original reactant position, the reaction has started but has not finished. If, later, only the product spot remains, that is evidence that the reactant has been used up under the TLC conditions.
This is a stronger answer than saying "TLC separates colours". In OCR organic analysis, the point is usually to compare standards, identify components or monitor reaction progress.
Continue this lesson.
You’re previewing NovaLearn without an account. Create a free account to read the rest.
Create free account