4.2.4(c)-(d) - IR spectrum interpretation
An infrared spectrum is evidence about bonds in an organic molecule. In this lesson you will learn how to use the supplied IR data to identify alcohols, aldehydes or ketones, and carboxylic acids from their characteristic absorptions. The skill is not to memorise a whole table; it is to read a spectrum carefully, link peaks to bonds, and make a conclusion that fits all the evidence.
Reading the spectrum
An IR spectrum is a graph. The horizontal axis is wavenumber, measured in . The vertical axis is often transmittance. A downward peak means that radiation at that wavenumber has been absorbed by a bond vibration.
In OCR examinations, the infrared absorption data are provided on the data sheet. That means the key skill is using the data, not memorising every number. For this lesson, the most useful data-sheet ranges are:
| Bond responsible for absorption | Where OCR's data sheet places it |
|---|---|
| O-H in alcohols and phenols | |
| O-H in carboxylic acids | , broad |
| C=O in aldehydes, ketones, carboxylic acids and other carbonyl compounds | |
| C-H in alkyl groups, alkenes and arenes |
The spectrum axis is commonly drawn from high wavenumber on the left to low wavenumber on the right. Do not let that reverse scale make you read the value backwards. Match the position of a peak to the wavenumber scale, then compare it with the supplied data.
[DIAGRAM: asset_name: Lesson 4.2.4c-d: IR spectrum interpretation - diagram 01; asset_slug: 04_02_04b_ir_spectrum_interpretation__diagram_01; recommended_method: drawn_chem; description: Pale-colour, white-background schematic comparing diagnostic IR patterns for an alcohol, an aldehyde or ketone, and a carboxylic acid, with OCR data-sheet ranges for O-H, C=O and common C-H absorptions.]
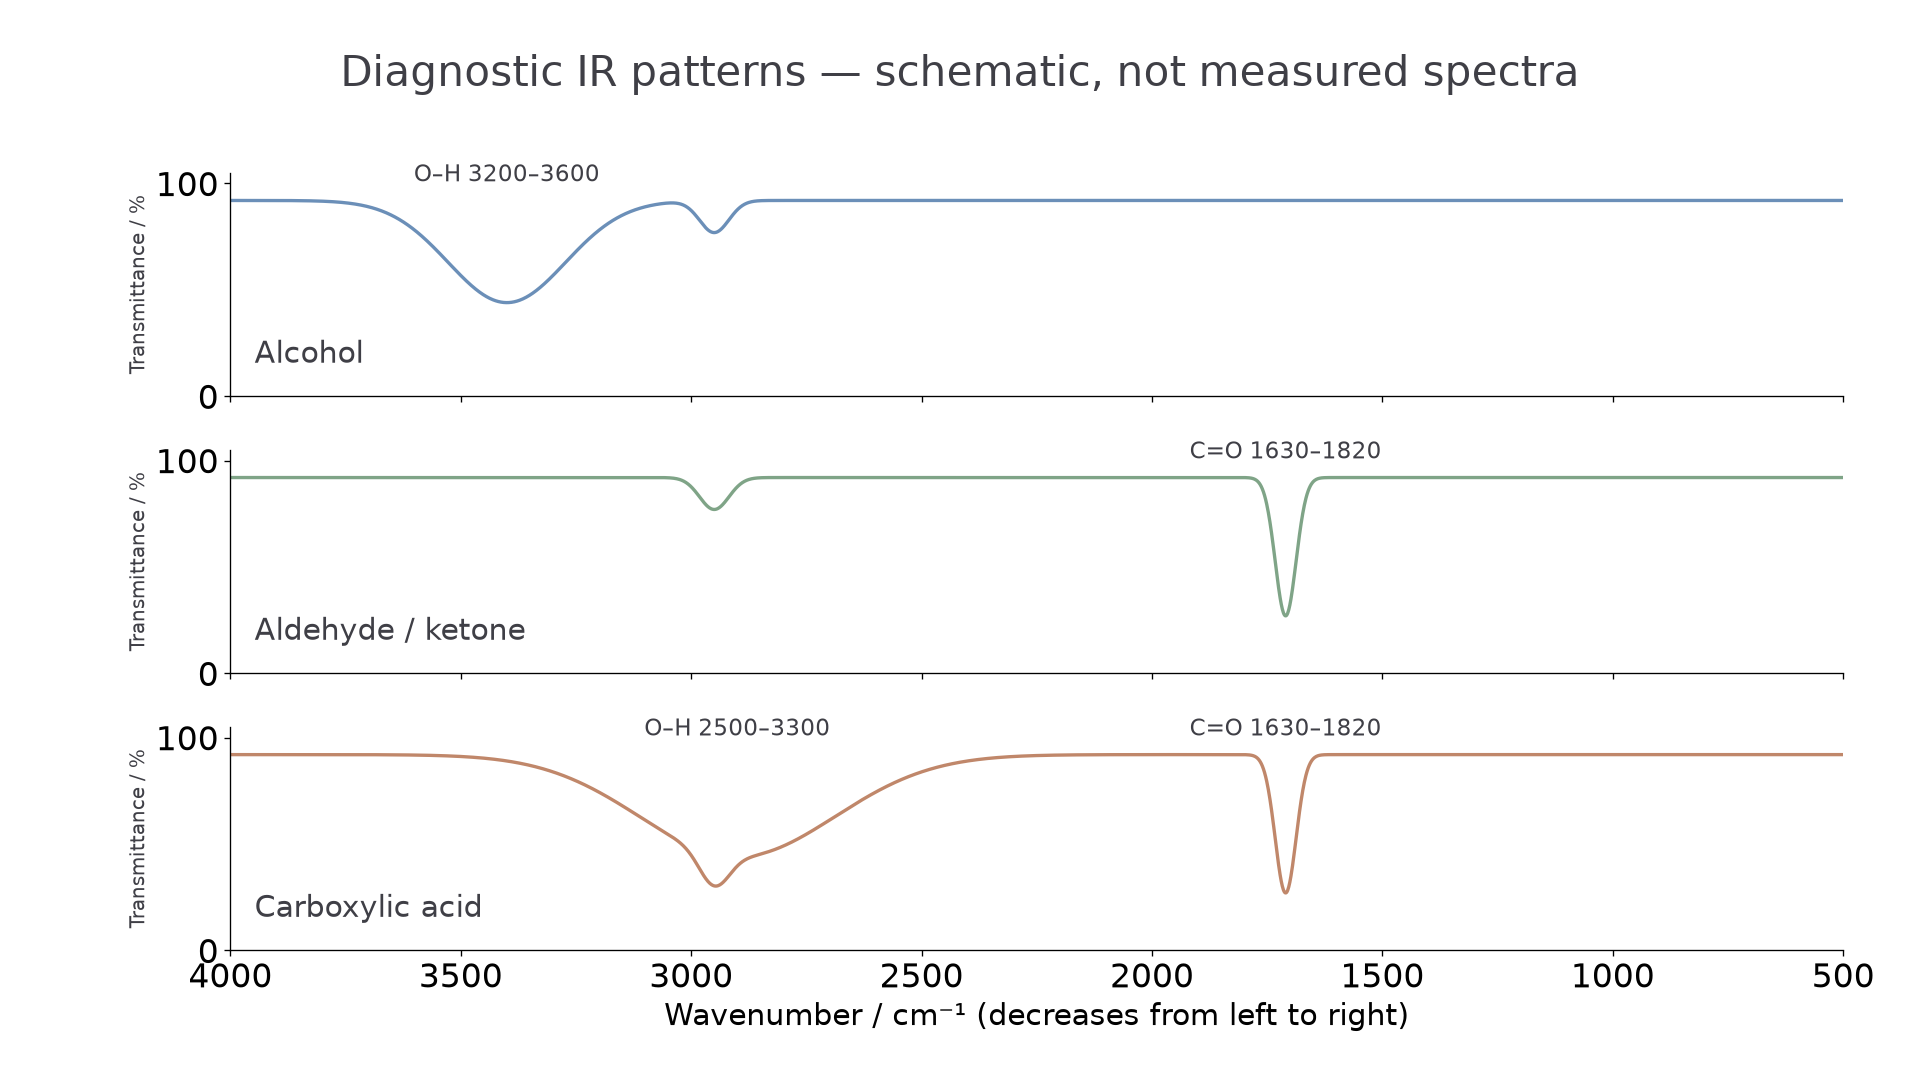
OCR also expects you to know one common background feature: most organic compounds have C-H bonds, so most organic IR spectra have an absorption near . A peak near is therefore not, by itself, enough to identify a functional group. The diagnostic peaks in this lesson are the O-H and C=O absorptions and, especially, their combination.
Alcohol O-H absorption
An alcohol contains an O-H bond in the hydroxyl group. In an IR spectrum, an alcohol can be identified from an O-H absorption in the region. The O-H absorption is usually broad, so it looks wider than a sharp single peak.
Worked example: a spectrum has a broad absorption centred around , and there is no strong absorption around . The broad absorption lies in the alcohol O-H range on the data sheet. The absence of a strong C=O peak means the evidence fits an alcohol rather than a carbonyl compound.
Write the reasoning in a mark-scheme friendly way:
broad absorption at about shows an O-H bond, so the compound could be an alcohol
That wording links the peak position to the bond. It is stronger than simply writing "alcohol peak", because OCR rewards clear analysis of spectral evidence.
A common error is to see any feature near and call it O-H. First ask whether the feature is broad and whether it lies in the relevant O-H range. A normal C-H absorption around is expected in many organic compounds and should not be overinterpreted.
Carbonyl and carboxylic acid patterns
Aldehydes and ketones both contain the carbonyl group, C=O. In this lesson, the key IR evidence for an aldehyde or ketone is a strong absorption in the C=O range, .
Carbonyl Group
A carbonyl group contains a carbon atom double-bonded to an oxygen atom, written as C=O.
Worked example: a spectrum has a strong sharp absorption at and no broad O-H absorption. The peak lies in the C=O range, so the compound contains a carbonyl group. If the possible functional groups are aldehyde and ketone, this IR evidence identifies the compound as an aldehyde or ketone.
A carboxylic acid is different because it contains both a C=O bond and an O-H bond in the carboxyl group, COOH. The IR pattern for a carboxylic acid is therefore:
- a C=O absorption in the region
- a broad O-H absorption in the region
Continue this lesson.
You’re previewing NovaLearn without an account. Create a free account to read the rest.
Create free account