4.2.4(f)-(g) - Organic mass spectrometry
Mass spectrometry helps chemists identify an organic compound by weighing ions made from its molecules. In this lesson, you will learn how to read the molecular ion peak to find molecular mass, how to avoid being misled by a small M+1 peak, and how fragment peaks can suggest pieces of a structure.
Reading the spectrum
A mass spectrum is a graph. The horizontal axis is , which means mass-to-charge ratio. The vertical axis is relative intensity, so the tallest peak is set to 100 and the other peaks are compared with it.
OCR limits this work to ions with single charges. That is a helpful boundary: if the charge is , the value is the relative mass of the ion.
Molecular ion
The molecular ion is the positive ion formed from the whole molecule. It is often written as , and its peak gives the relative molecular mass, , when the ion has a single positive charge.
The tallest peak is called the base peak. It is the most intense peak, but it is not automatically the molecular ion peak. In organic spectra, the base peak is often a stable fragment ion.
[DIAGRAM: asset_name: Lesson 4.2.4f-g: Organic mass spectrometry - diagram 01; asset_slug: 04_02_04c_organic_mass_spectrometry__diagram_01; recommended_method: drawn_chem; description: Labelled stick mass spectrum showing fragment peaks at lower m/z, the base peak, the molecular ion peak M+ at m/z 58, and a small M+1 peak from carbon-13.]
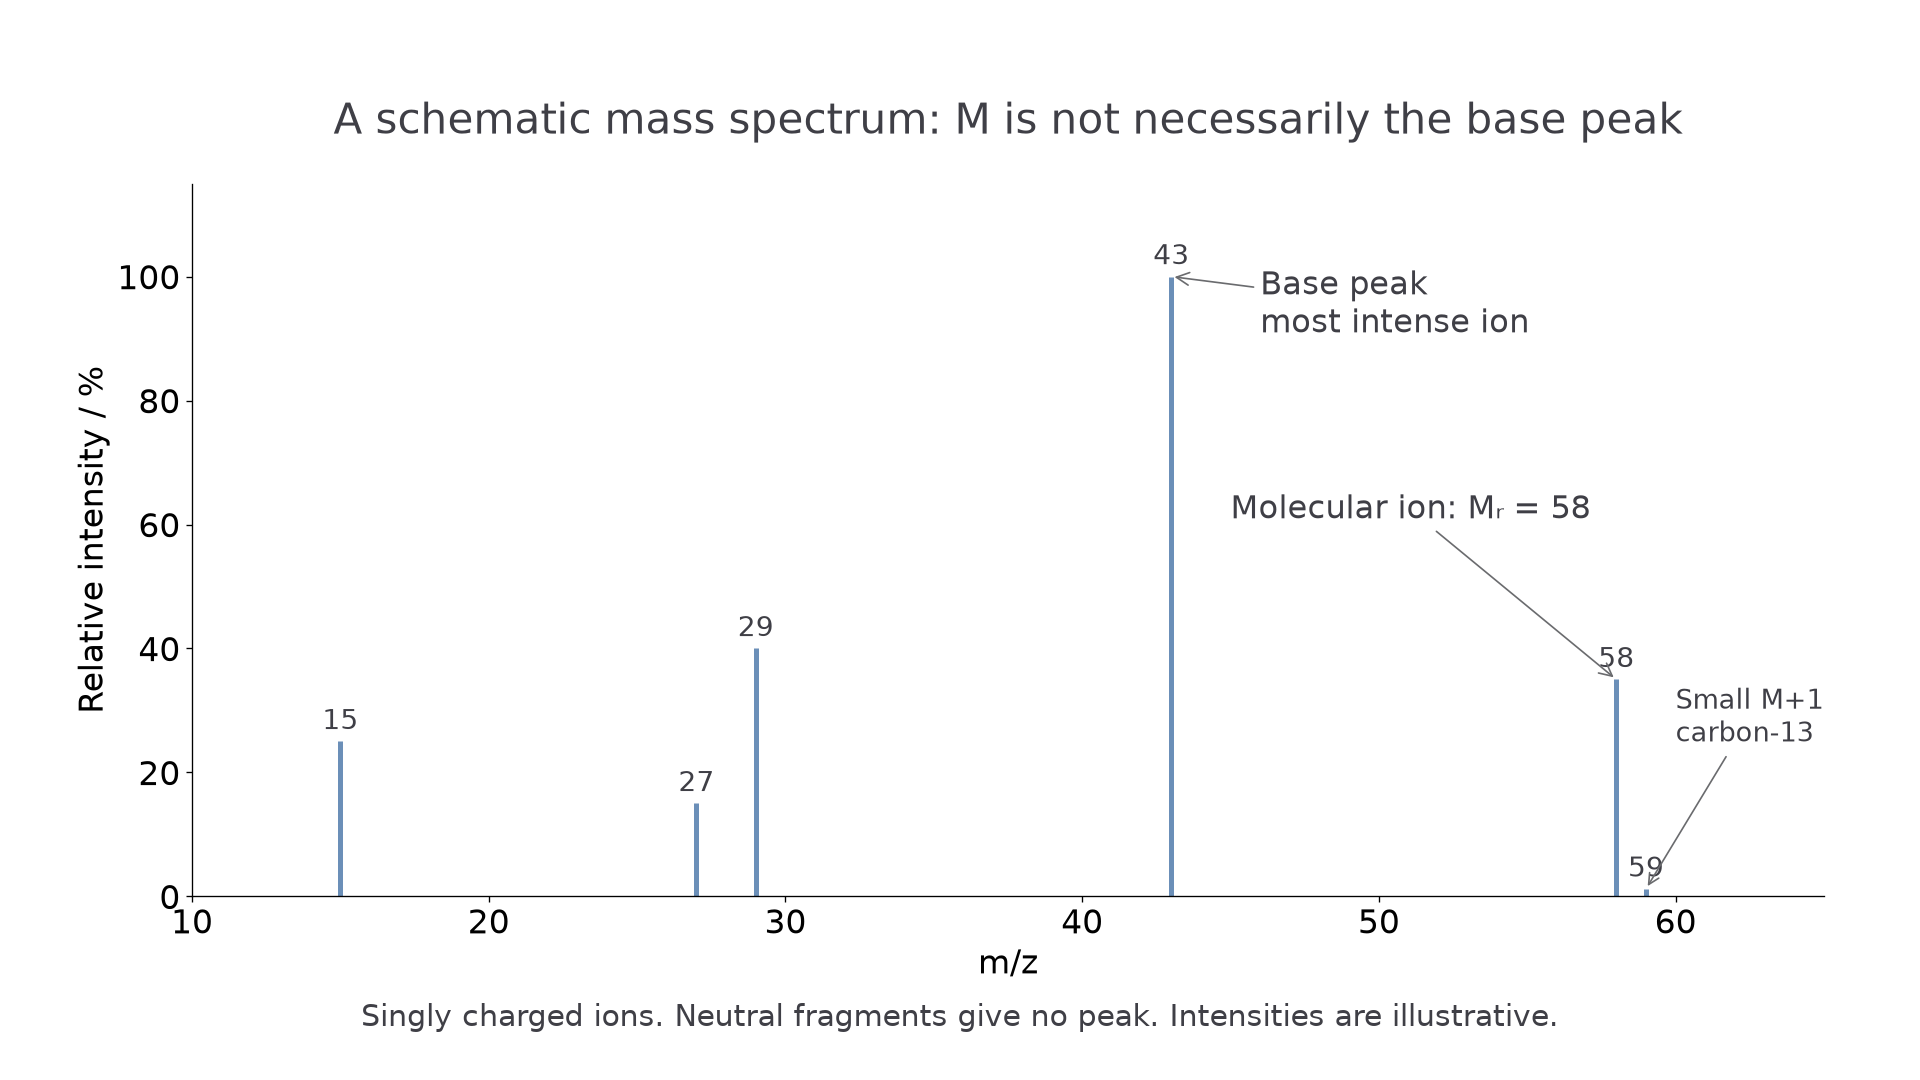
Worked example: a spectrum has a molecular ion peak at . The ion is singly charged, so the molecular ion has relative mass 72. The compound therefore has .
Molecular ion and m+1
To find the molecular ion peak, look for the highest significant peak for the main molecule. There is one important caution: an organic spectrum may contain a very small peak one unit higher than the molecular ion peak. This is the peak.
The peak is caused by the small proportion of carbon atoms that are carbon-13 instead of carbon-12. Carbon-13 is one mass unit heavier than carbon-12, so a molecule containing one carbon-13 atom gives a molecular ion one unit heavier than the usual molecular ion.
This lesson only needs carbon-13 as an awareness point. Do not treat as the molecular ion peak, and do not use halogen isotope patterns here: OCR does not expect you to interpret mass spectra of organic halogen compounds at this stage.
Worked example: a spectrum has peaks at and a much smaller peak at . The peak at 59 is labelled as a small peak. The molecular ion peak is therefore at 58, so .
Fragmentation peaks
After the molecular ion forms, some molecular ions break into smaller pieces. If a piece is positively charged, it can be detected and gives a peak. If a piece is neutral, it is not detected by the mass spectrometer.
Fragment ion
A fragment ion is a positively charged piece formed when the molecular ion breaks apart. Its value can suggest a part of the original organic structure.
Fragment analysis is partly arithmetic and partly structure. For example:
- has mass , so it may give a peak at .
- has mass , so it may give a peak at .
- also has mass , so the same value can sometimes fit more than one fragment.
- has mass , so it may give a peak at .
An oxygen-containing fragment can have the same nominal mass as a hydrocarbon fragment. For example, has mass , just like . Write connectivity as well as atom counts when asked for a structure. The ethanoyl fragment can be represented as , and the hydrocarbon ion may be or , depending on the parent.
Continue this lesson.
You’re previewing NovaLearn without an account. Create a free account to read the rest.
Create free account