5.1.3(n)-(o) - pH titration curves, indicators and pH meters
A pH titration curve shows how pH changes as one acid-base solution is added to another. In this lesson, you will learn how to read the shape of these curves, choose a suitable indicator from a given pH range, explain indicator colour changes using an acid-base equilibrium, and measure pH accurately with a pH meter.
Reading a pH titration curve
A pH titration curve is a graph of pH against volume of acid or base added. The exact numbers depend on the concentrations and the acid/base strengths, but the shape tells you a lot before you do any calculation.
Equivalence point
The equivalence point is the point where the acid and base have reacted in the exact mole ratio shown by the equation. It is a stoichiometric point, not automatically pH 7.
End point
The end point is the point at which an indicator changes colour. A good indicator has an end point close to the equivalence point, within the steep part of the pH curve.
The steep, almost vertical section matters because a tiny extra volume of titrant causes a large change in pH. That is why an indicator can work: its whole colour-change range can fit inside that rapid pH change.
Avoid calling the equivalence point the neutral point. For a strong acid and strong base, the equivalence point is close to pH 7. For weak acid/strong base or strong acid/weak base titrations, the salt formed affects the pH at equivalence, so the equivalence point is not neutral.
Suppose 25.0 of a monobasic acid is titrated with 0.100 , and the midpoint of the vertical section is read at 24.8 . If the acid reacts 1:1 with , then:
Using the equivalence volume
The curve supplies the equivalence volume; the mole calculation is the usual titration stoichiometry from earlier work. In OCR-style graph questions, use a smooth best-fit curve and read the middle of the steep section, not a random plotted point.
The half-equivalence point
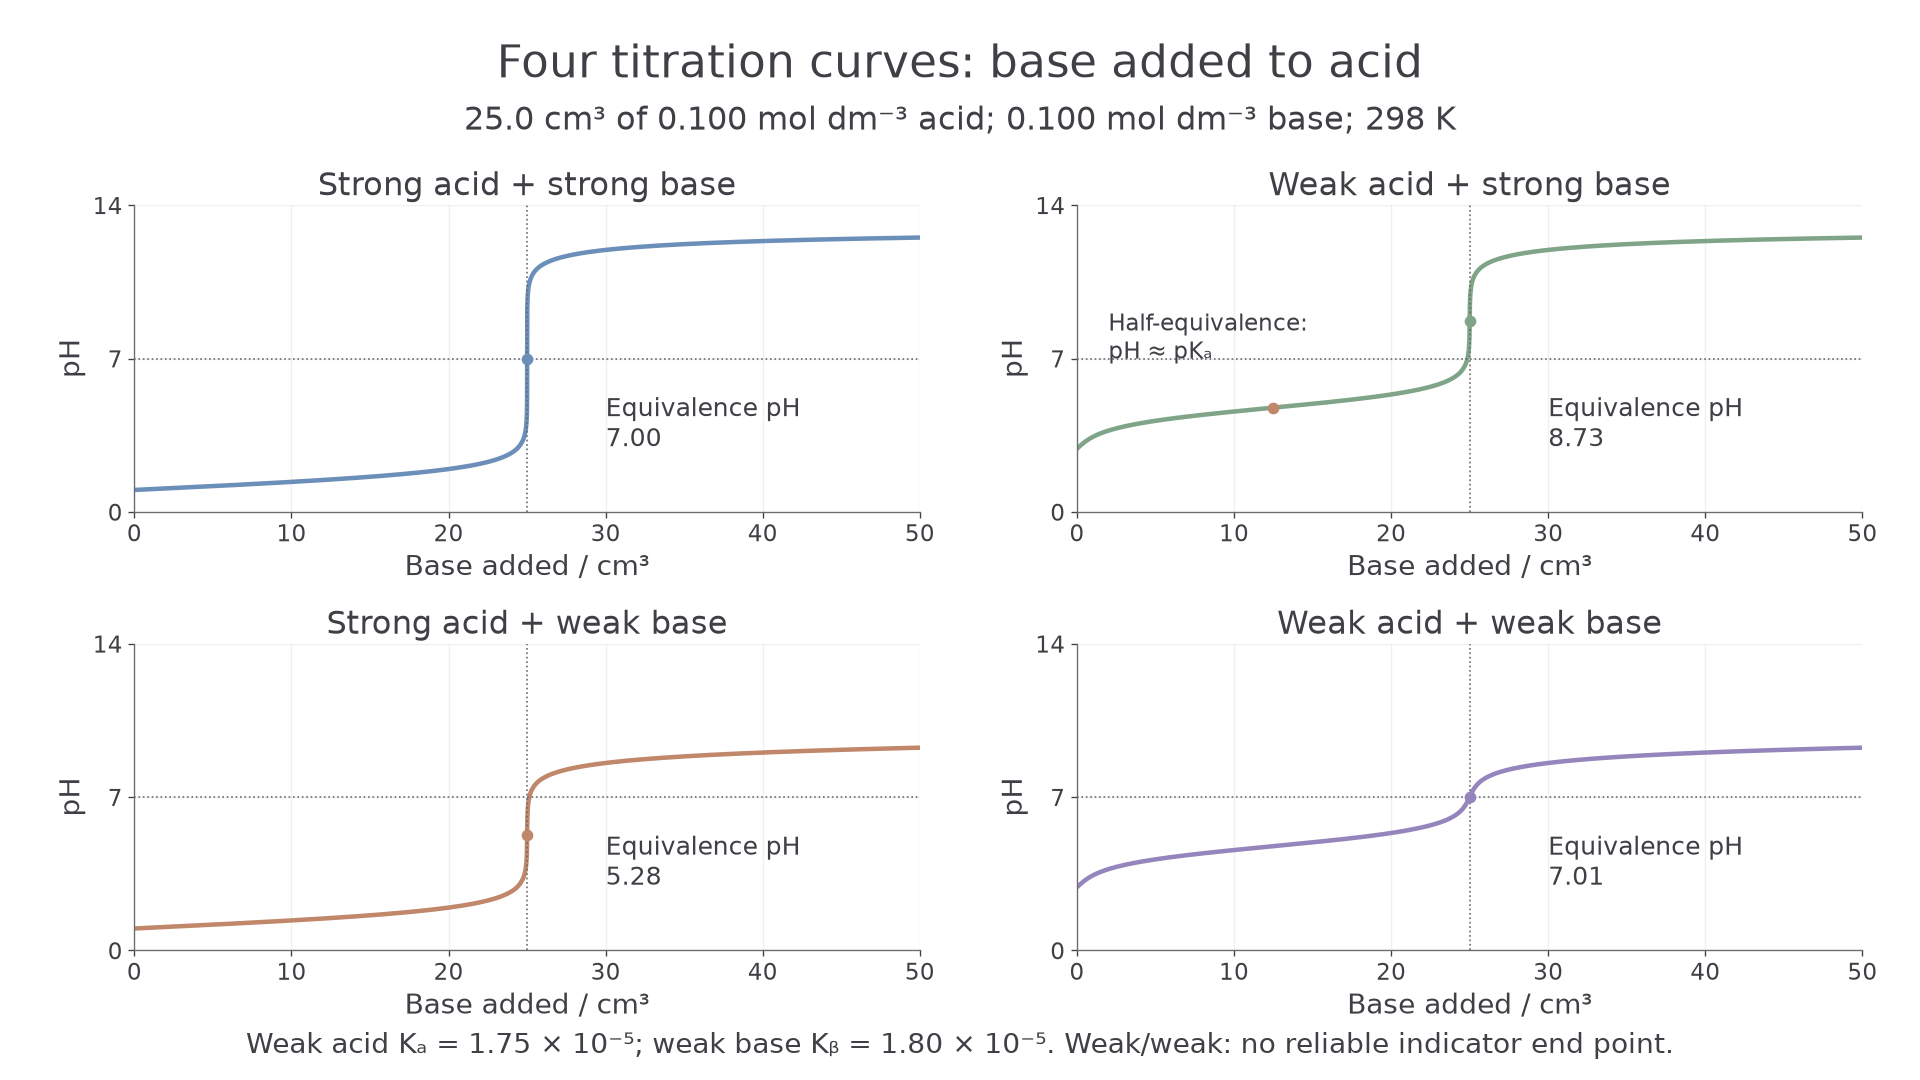
During a weak monobasic acid–strong base titration, at half the equivalence volume, half the original HA has become . Their amounts and concentrations are equal. Hence and . For example, if equivalence is at 20.0 and pH at 10.0 is 4.90, . This buffer relationship does not apply at equivalence, where essentially all original HA has been neutralised.
The four curve families
These familiar curve comparisons assume comparably concentrated solutions, typically about 0.1 , at 25 . Starting pH alone cannot establish acid/base strength without concentration information; read it together with the equivalence region and direction of addition.
The four OCR-required combinations are easiest to compare with the same convention: acid in the flask, base added from the burette. If the acid is added to a base instead, the curve is the same chemistry but runs in the opposite direction: it starts high and falls.
For a strong acid with a strong base, the curve starts at a low pH, changes slowly, then rises very sharply near pH 7, before levelling off at high pH. The solution at equivalence contains a salt from a strong acid and strong base, so the equivalence pH is close to 7.
For a weak acid with a strong base, the curve starts at a higher pH than a strong acid curve. Before equivalence, the partially neutralised mixture contains the weak acid and its conjugate base, so the pH changes more gradually. The equivalence point is above pH 7 because the conjugate base reacts with water to produce some .
For a strong acid with a weak base, the equivalence point is below pH 7. The conjugate acid formed from the weak base makes the solution acidic at equivalence. The curve still has a steep section, but it is shorter than the strong acid/strong base curve.
For a weak acid with a weak base, there is no sharp vertical section. The pH changes too gradually for a visual indicator to give a reliable end point. This is an OCR boundary point: no indicator is suitable for a weak acid/weak base titration.
To identify a curve, read the starting pH, final pH, position of the equivalence point relative to pH 7, and whether there is a steep vertical section.
[DIAGRAM: asset_name: Four pH titration curves; asset_slug: 05_01_03e_ph_titration_curves_indicators_and_ph_meters__diagram_01; recommended_method: matplotlib; description: Computed titration curves for 25.0 cm3 of 0.100 M strong or weak acid with 0.100 M strong or weak base, exact equivalence at 25.0 cm3 and half equivalence on the weak acid-strong base curve.]
Choosing a suitable indicator
An acid-base indicator has a pH range over which its colour changes. OCR questions usually give this range in a table. Your job is not to memorise a name; your job is to match the indicator range to the steep vertical section of the pH curve.
A suitable indicator changes colour during the rapid pH change, so that a small volume error gives only a tiny titre error. If the indicator range lies on a flat part of the curve, the colour would change too early or too late.
For a strong acid/strong base titration, the vertical section is very long, so several indicators may work. For a weak acid/strong base titration, the useful vertical section is in the alkaline region, so a higher-pH indicator such as phenolphthalein is often suitable if its given range lies in the steep section. For a strong acid/weak base titration, the useful vertical section is in the acidic region, so a lower-pH indicator such as methyl orange may be suitable if its given range lies in the steep section.
For a weak acid/weak base titration, do not try to rescue the method by choosing a "near enough" indicator. OCR states that no indicator is suitable because there is no sharp vertical section. Use a pH meter or pH probe if the pH change must be followed.
Worked example:
A titration curve has a rapid pH change from pH 7.8 to pH 11.0. Three indicators are available.
Continue this lesson.
You’re previewing NovaLearn without an account. Create a free account to read the rest.
Create free account