4.2.4(h) - Combined organic analysis
Organic analysis questions are often small detective stories. One piece of data gives a formula, another gives a mass, another gives functional groups, and the correct structure is the one that makes all of them agree. In this lesson you will learn a repeatable OCR-style route for combining elemental analysis, mass spectra and IR spectra without overclaiming from one clue.
What each technique gives
Combined organic analysis means using several analytical results together to deduce a structure. Each technique answers a different question, so the order matters.
[DIAGRAM: asset_name: Lesson 4.2.4h: Combined organic analysis - diagram 01; asset_slug: 04_02_04d_combined_organic_analysis__diagram_01; recommended_method: drawn_chem; description: Flowchart showing elemental analysis, mass spectrum and IR spectrum converging on molecular formula, functional groups and one feasible organic structure, with OCR boundary cautions.]
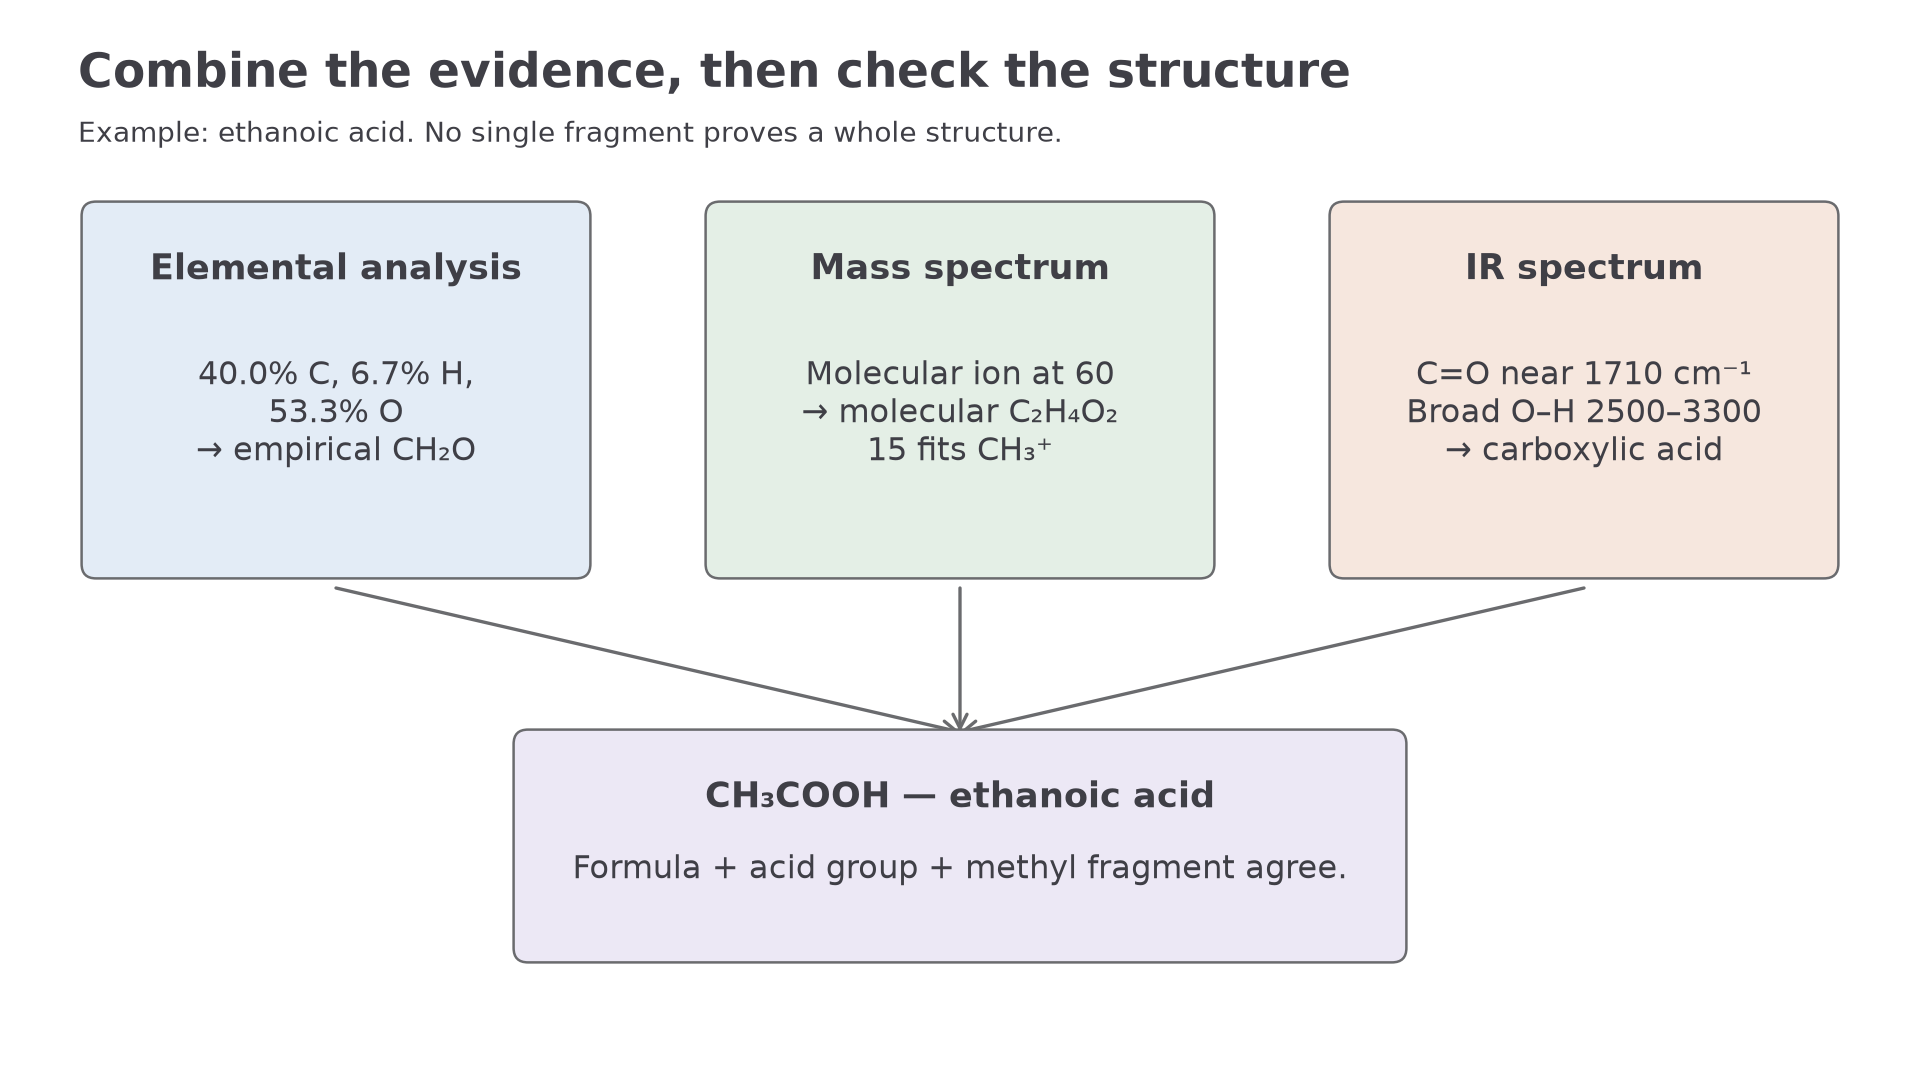
Combined organic analysis
Combined organic analysis is the deduction of an organic structure by interpreting different analytical data and checking that every conclusion is consistent with the same compound.
For this specification point, the three evidence sources are:
- elemental analysis: percentage composition by mass, used to find an empirical formula
- mass spectra: the molecular ion peak and fragment ions, used to find molecular mass and structural clues
- IR spectra: characteristic absorptions, used to identify bonds and functional groups
The OCR boundary is important. You should stay with functional groups encountered in the specification, and you will not be expected to interpret mass spectra of organic halogen compounds. Later in the course, combined structure-deduction questions may use NMR as well, but this lesson is only about elemental analysis, mass spectra and IR spectra.
A strong answer does not simply list clues. It connects them: "The molecular formula is ..., the IR spectrum shows ..., the fragment peak supports ..., so the structure is ...".
Elemental to molecular formula
Elemental analysis normally gives percentages by mass. The calculation is the same idea as finding an empirical formula from masses: convert each percentage to an amount in moles, divide by the smallest value, and then scale to whole numbers.
Empirical formula from percentage composition
Percentages are convenient because you can imagine a 100 g sample. If a compound contains only C, H and O and the oxygen percentage is not stated directly, find it by difference:
Once you have the empirical formula, compare its relative formula mass with the molecular mass from the molecular ion peak, . For singly charged molecular ions, the m/z value of equals the relative molecular mass, .
Worked example:
An organic compound contains C, H and O only. Its percentage composition is C = 52.2%, H = 13.0%, O = 34.8%. Its mass spectrum has a molecular ion peak at m/z = 46. Deduce the molecular formula.
- Convert percentage to moles.
| element | percentage | divide by Ar | amount ratio |
|---|---|---|---|
| C | 52.2 | 52.2 / 12.0 | 4.35 |
| H | 13.0 | 13.0 / 1.0 | 13.0 |
| O | 34.8 | 34.8 / 16.0 | 2.175 |
- Divide by the smallest value, 2.175.
The ratio is approximately 2:6:1, so the empirical formula is .
- Compare formula masses.
The empirical formula mass of is:
The molecular ion peak gives = 46, so the molecular formula is also .
An equally valid route: use one mole of compound
Once is known, one mole of compound has mass 46 g. Use the mass fractions directly to find how many atoms of each element occur in one molecule:
This again gives . These are atom counts per molecule, found by comparing moles of each element with one mole of compound. It is an alternative to the empirical-formula route, not extra compulsory working. Small deviations from integers reflect rounded percentage data.
Notice what this does and does not prove. tells you the atoms present, but it does not by itself choose between ethanol and methoxymethane. You still need IR and mass-fragment evidence.
Mass spectrum constraints
In organic structure deduction, the molecular ion peak is usually the first mass-spectrum clue to use. It gives the molecular mass, which helps convert an empirical formula into a molecular formula.
Molecular ion peak
The molecular ion peak is the peak caused by the molecular ion, , formed when a molecule loses one electron but remains otherwise intact.
The molecular ion peak is not necessarily the tallest peak. The tallest peak is the base peak; the molecular ion peak is the one due to the intact molecule and is often identified by its high m/z value or by the way the question labels the spectrum.
Fragment peaks then give supporting evidence. A fragment ion is a positively charged piece of the original molecule. For example:
- m/z 15 can be
- m/z 29 can be or
- m/z 43 can be or
These examples show why fragments should be used carefully. A single m/z value is not always unique, so OCR-style reasoning should connect the fragment to the molecular formula and the IR evidence.
Worked reasoning:
Continue this lesson.
You’re previewing NovaLearn without an account. Create a free account to read the rest.
Create free account