SF1, SF2, SF4 - Exponential distributions
SF1 introduces a continuous model for waiting times, its assumptions, density and cumulative distribution function. SF2 uses it to calculate probabilities; SF4 explains its connection to counts of Poisson events. You will keep rates and time units consistent and discover why an elapsed wait need not change the remaining wait's distribution.
Conditions for an exponential model
A detector records particles at a constant mean rate, independently and singly. If no particle has appeared for a minute, is one now “due”? A long empty spell need not make the next event more imminent.
In a homogeneous Poisson process, events occur at a constant positive mean rate, counts in disjoint intervals are independent, and events occur singly. More precisely, for a very short interval of length , the probability of one event is approximately , and the probability of two or more is negligible compared with . These are the process conditions behind the Poisson count model.
A Poisson variable counts how many events occur in a fixed interval. An exponential variable measures the nonnegative waiting time to the next event in this process. Here is a rate per unit time, not a mean count in an arbitrary interval. Counts over a duration have Poisson mean .
Exponential distribution
Write using the rate parameter . It describes a continuous waiting time with a constant rate of occurrence throughout the waiting period. Under the homogeneous Poisson process conditions, each interval between consecutive events has this distribution.
This is a model assumption, not a consequence of the word “random”. A component whose failure tendency increases as it wears out does not have a constant failure rate. A detector with a recovery period after each event prevents immediate new detections, breaking the process conditions. Rush-hour arrivals across a whole day have a varying rate. Equally spaced departures produce a different waiting model even if a traveller arrives unpredictably.
In a lifetime setting, a constant failure rate means the chance of failing in a short additional period, conditional on having survived so far, does not depend on age. It does not mean the density of the total lifetime is constant. Exponential lifetimes are concentrated towards shorter durations, as the next part shows.
Key idea
Use a Poisson model for a count in a fixed interval and an exponential model for a waiting time under the corresponding constant-rate process conditions.
Identify the appropriate random quantity.
The density and cumulative distribution
For a rate per minute, the exponential density starts at height and decays as time increases. This makes a short wait more likely than an equally wide interval much later. It leaves some probability beyond every finite time.
Exponential density and CDF
For in the rate convention, with ,
These formulae are not printed in the AQA formula booklet: learn them. A density value at the single endpoint 0 can be changed harmlessly.
The density is nonnegative. Its total area is
because . Accumulating only as far as gives . Differentiating that CDF returns the density for .
Worked example 1: accumulating density area
Question. , with in minutes. Find by integrating the density.
Plan. Integrate from the lowest possible wait to the stated upper bound.
Answer. .
Check. Substituting 2 into the CDF gives , the same result.
Double only the rate. The same two-minute interval now captures more of the probability.
Worked example 2: a faster rate
Question. , with in minutes. Find by integrating the density.
Plan. Use the new rate in both the coefficient and exponent.
Answer. .
Check. The tail is now , smaller than the previous tail . Faster events make a wait beyond two minutes less likely.
The density and CDF express the same distribution on different vertical scales.
[DIAGRAM: asset_name: Exponential densities and cumulative probabilities; asset_slug: aqa7367-exponential-curves; caption: Increasing the rate concentrates waiting times nearer zero and makes cumulative probability rise faster; description: Two side-by-side plots show rate one half in blue and rate one in sage for nonnegative time. The left plot shows densities one half times exp minus t over two and exp minus t. The right shows their CDFs one minus exp minus t over two and one minus exp minus t, starting at zero and approaching one. A dashed vertical at time two marks CDF values approximately 0.632 and 0.865. The horizontal asymptote one is marked only on the CDF plot.]
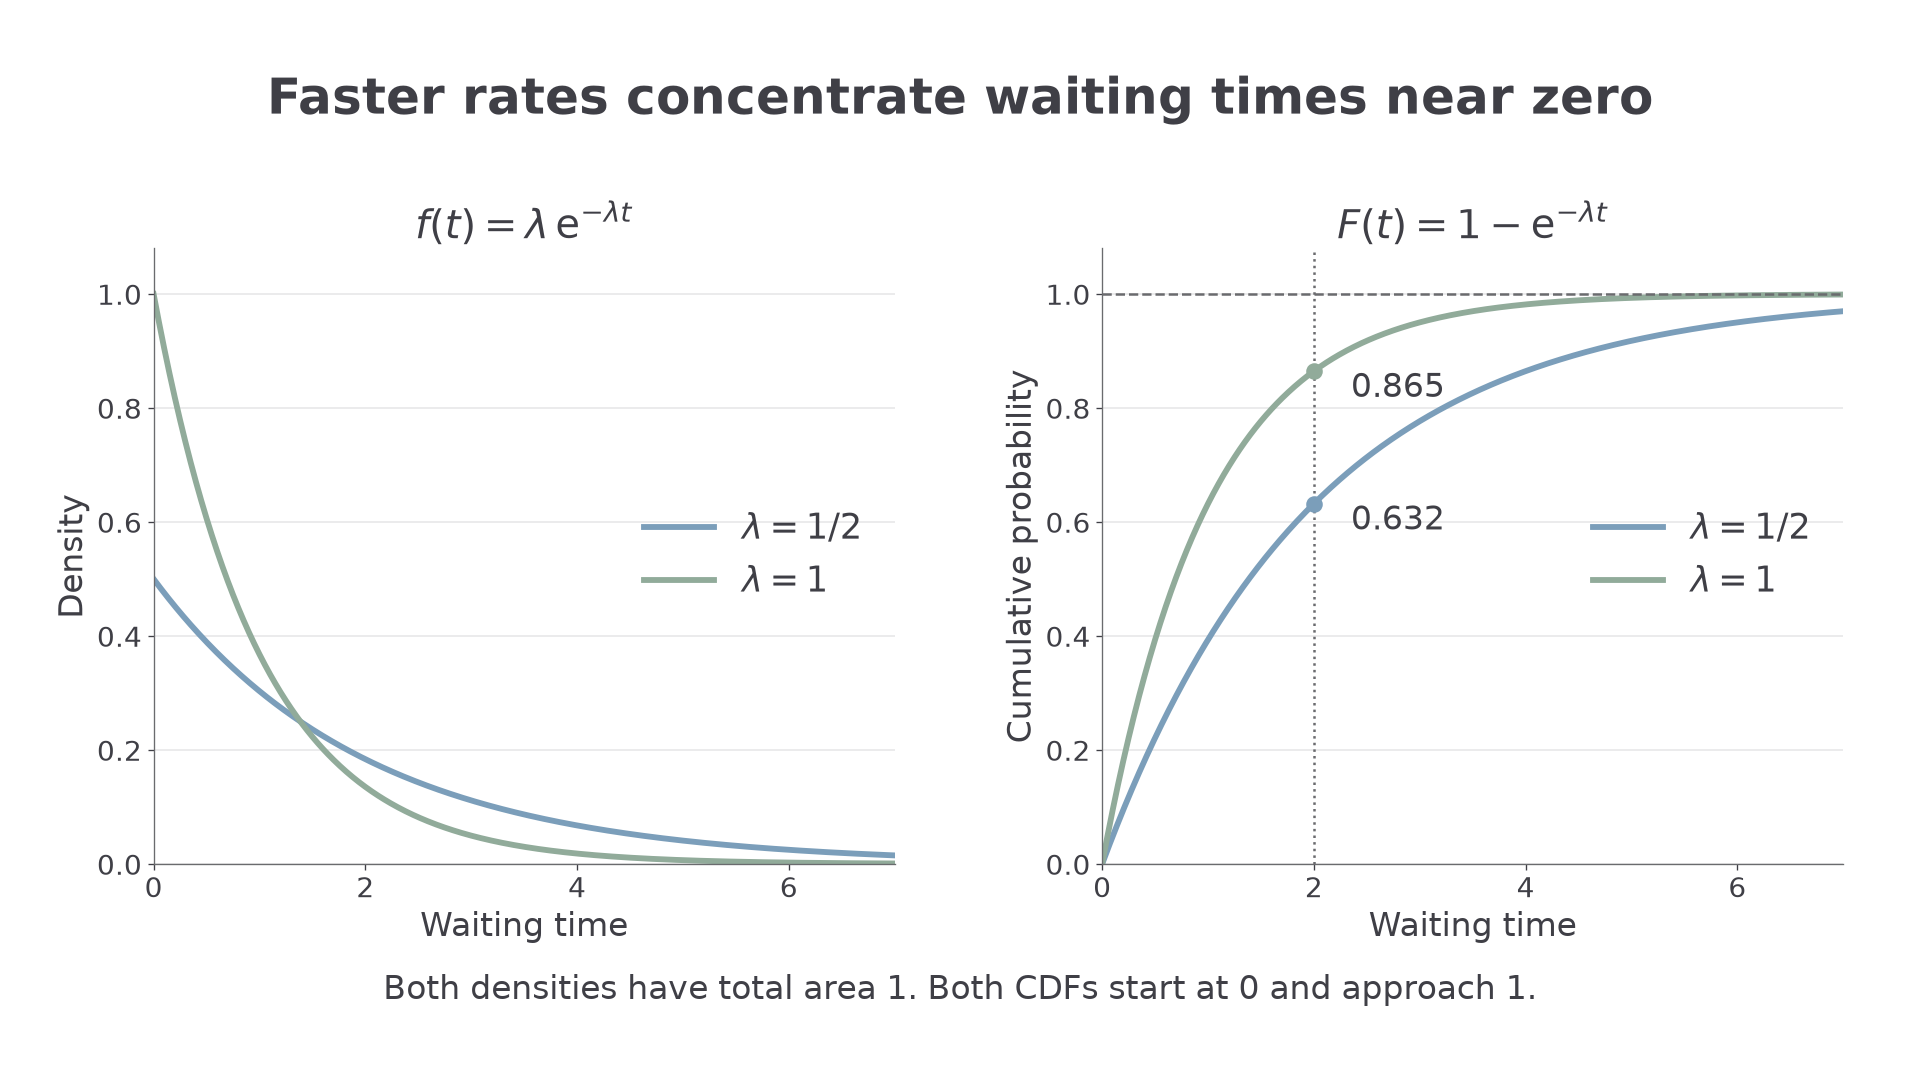
Since this is a pure density, , even though the density can be positive there. The CDF has , no jump at 0, and limit 1 as . A zero rate would make the alleged density zero everywhere, so is excluded.
Watch out
Wrong: integrate the CDF to find , or omit from the density coefficient. Integrate , or substitute directly into ; use the full nonnegative support.
Use both representations for a fresh rate.
Interval and tail probabilities
The survival probability is the chance that the waiting time exceeds a chosen duration. Complementing the CDF makes it particularly simple.
Exponential probabilities
For , , and ,
Strict and inclusive endpoints agree for this pure continuous distribution. These formulae follow from the CDF and are not printed in the booklet.
For a negative bound, use the support: and when . For an interval crossing zero, integrate from zero. Do not extend the positive-time tail formula to negative times.
Worked example 3: waiting beyond a boundary
Question. , with in minutes. Find .
Plan. Use the survival probability at 3.
Answer. , to four decimal places.
Check. Direct integration gives
Keep the lower boundary, but cap the wait at 5 minutes. Subtract the tail beyond 5 from the tail beyond 3.
Continue this lesson.
You’re previewing NovaLearn without an account. Create a free account to read the rest.
Create free account