DE5 - Gantt charts and resource histograms
A network shows which jobs must wait; a Gantt chart shows when they run. You will draw time bars with clearly distinguished float, combine simultaneous resource requirements into a histogram and interpret its peak, area and periods of unused capacity.
Constructing time bars from a schedule
Can a project finish in nine days even though its first schedule needs five workers at once? To see both the timing and the demand, we need two different pictures. Start with this project, released at time zero. Each activity runs continuously for its fixed duration and uses its stated number of workers throughout.
| Activity | Duration (days) | Immediate predecessors | Workers |
|---|---|---|---|
| A | 4 | None | 3 |
| B | 3 | None | 2 |
| C | 4 | A | 1 |
| D | 1 | B, C | 1 |
The earliest completion is 9 days: A–C–D is a nine-day chain. B may finish any time up to 8 without delaying D, so its total float is days.
Gantt or cascade diagram
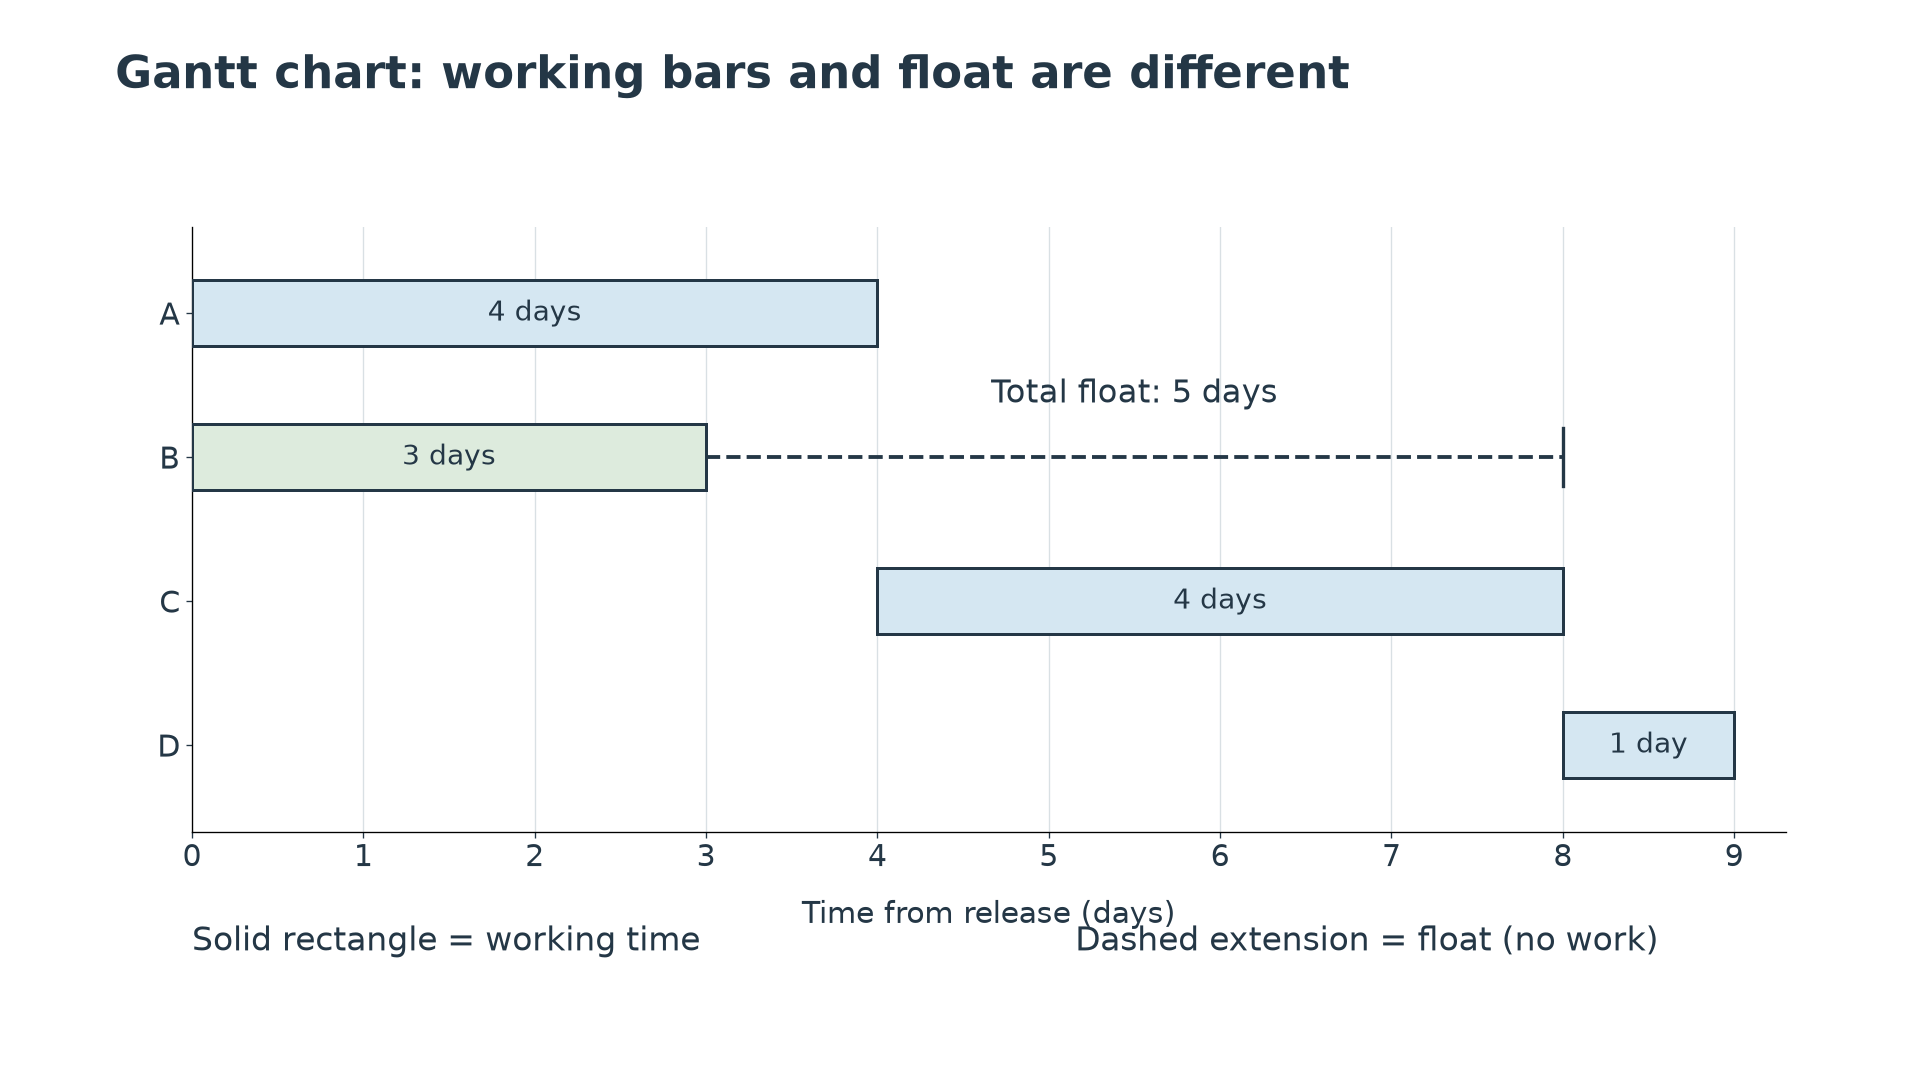
A Gantt chart, also called a cascade diagram, puts time on the horizontal axis and activities on labelled rows. An activity starting at with duration has a working bar from to . To display an earliest-start critical-path plan, show any total float separately, for example as a dashed extension from earliest finish to latest finish. The extension is available movement, not additional work.
All intervals here are : an activity ending at time 4 releases its workers for another starting at time 4. Use the chart's key to distinguish working bars from float.
Worked example 1: earliest bars and float
Question. Draw the earliest-start Gantt chart for the four-activity table above, showing total float for a nine-day target.
Plan. Find ES, EF and LF, then draw solid working bars and a separate float style.
A runs , B , C , D . Backwards from 9, D starts latest at 8, C at 4, A at 0 and B at 5. Only B has nonzero float.
Answer. Draw the four labelled working bars at those intervals, with a dashed extension on B's row from 3 to 8. A, C and D have no extension.
Check. Solid lengths are 4, 3, 4 and 1, matching the durations. B's full early-to-late window is 8 days, made of 3 days' work and 5 days' float, not 8 days' work.
[DIAGRAM: asset_name: Gantt bars and available float; asset_slug: aqa7367-gantt-float; caption: B works for three days and has five days of float, while A C D control the nine-day finish; description: A Gantt chart with time zero to nine days shows solid bars A from zero to four, B from zero to three, C from four to eight and D from eight to nine. B alone has a dashed extension from three to eight labelled total float five days. A legend distinguishes solid working bars from the dashed float extension.]
Keep the network and nine-day target, but choose a later feasible start for B. This changes its actual bar, not its fixed duration.
Worked example 2: a later feasible working bar
Question. For the same four-activity project, schedule B at time 5. Keep A at 0, C at 4 and D at 8. Draw the working bars and check feasibility.
Plan. Add each duration to its chosen start and verify every precedence link.
B now occupies . The other bars remain A , C , D . A finishes when C starts; B and C both finish when D starts.
Answer. This is a feasible nine-day schedule. B's three-day working bar has moved five days to the right, using all its total float.
Check. B's bar still has length 3, and , matching D's start. The original five-day dashed extension was not a second task to schedule after B.
For an earliest-start cascade diagram, include the float as well as the working bars. For a chosen actual schedule, distinguish any remaining flexibility from its actual execution.
Watch out
A cascade diagram has activity rows and can show float. A resource histogram has resource quantity vertically. Drawing one when asked for the other loses the information the question requests.
Separate the working intervals from the available float in the next project.
Aggregating resources by time interval
A resource histogram adds the workers required by the activities actually running together. The demand changes only when an activity starts or finishes. Use every distinct boundary time, then add the active requirements between consecutive boundaries.
Resource demand
For activities running without interruption on intervals , each requiring a constant workers,
The histogram height is ; its horizontal width is elapsed time. These scheduling rules are not supplied in the AQA formula booklet. Float requires no workers.
You may stack labelled activity rectangles so their total height shows demand, or draw the total-height outline with an accompanying activity schedule. Preserve the labels if the task asks to show how the work is arranged.
Worked example 3: the earliest resource histogram
Question. Find the resource histogram for A , 3 workers; B , 2 workers; C , 1 worker; D , 1 worker.
Plan. Split time at 0, 3, 4, 8 and 9, then sum active workers.
| Interval (days) | Active activities | Workers |
|---|---|---|
| A, B | ||
| A | 3 | |
| C | 1 | |
| D | 1 |
Answer. Heights 5, 3, 1, 1 on those intervals; the peak demand is 5 workers. The last two intervals may share one horizontal top at height 1, but C and D are different activities.
Check. Histogram area is worker-days. Summing activity work independently gives .
Now move only B to . Total work stays the same, but the overlap changes.
Continue this lesson.
You’re previewing NovaLearn without an account. Create a free account to read the rest.
Create free account