J1 - Mid-ordinate and Simpson’s rules
Numerical integration estimates a definite integral from a finite set of function values. You will build the mid-ordinate and Simpson’s rules, choose the right points and weights, and judge what a change of step size actually tells you about accuracy.
Build and use the quadrature rules
Can three heights give the exact area under from to , even though the boundary is curved? Rectangles give one estimate; a curved approximation gives another.
Quadrature means numerical integration. Split , with , into equal subintervals of width . The integral is a signed accumulation: negative heights contribute negatively. Geometric area requires separate treatment of any sign changes.
For the mid-ordinate rule, put one rectangle in each subinterval. Its height is the function value at that subinterval’s midpoint, not its left or right endpoint. Write and , allowing half-integer subscripts for midpoint values. Adding width times height gives the formula.
Mid-ordinate rule
For equal subintervals, where is an integer,
This rule is supplied on page 9 of the examination formula booklet. There are midpoint heights.
Simpson’s rule instead fits a quadratic through three equally spaced points, covering two subintervals at once. To see its weights, centre those points at and write the quadratic as . Then
The two expressions agree. Adding adjacent pairs counts each shared endpoint twice and gives the composite formula.
Simpson’s rule
For an even number of equal subintervals,
This rule, including the condition that is even, is supplied on page 9 of the examination formula booklet. For , there are no interior even-indexed terms.
[DIAGRAM: asset_name: Rectangles and a quadratic through the same curve; asset_slug: aqa7367-quadrature; caption: Midpoint rectangles estimate the area; a quadratic fit follows this quadratic exactly; description: Two coordinate panels show y equals one plus x squared from zero to two. The left has two width-one blue rectangles with heights 1.25 and 3.25 at x equals 0.5 and 1.5. The right marks the three Simpson ordinates at zero, one and two, with heights 1, 2 and 5; the quadratic interpolant coincides with the curve. Both panels have the same axes and scale.]
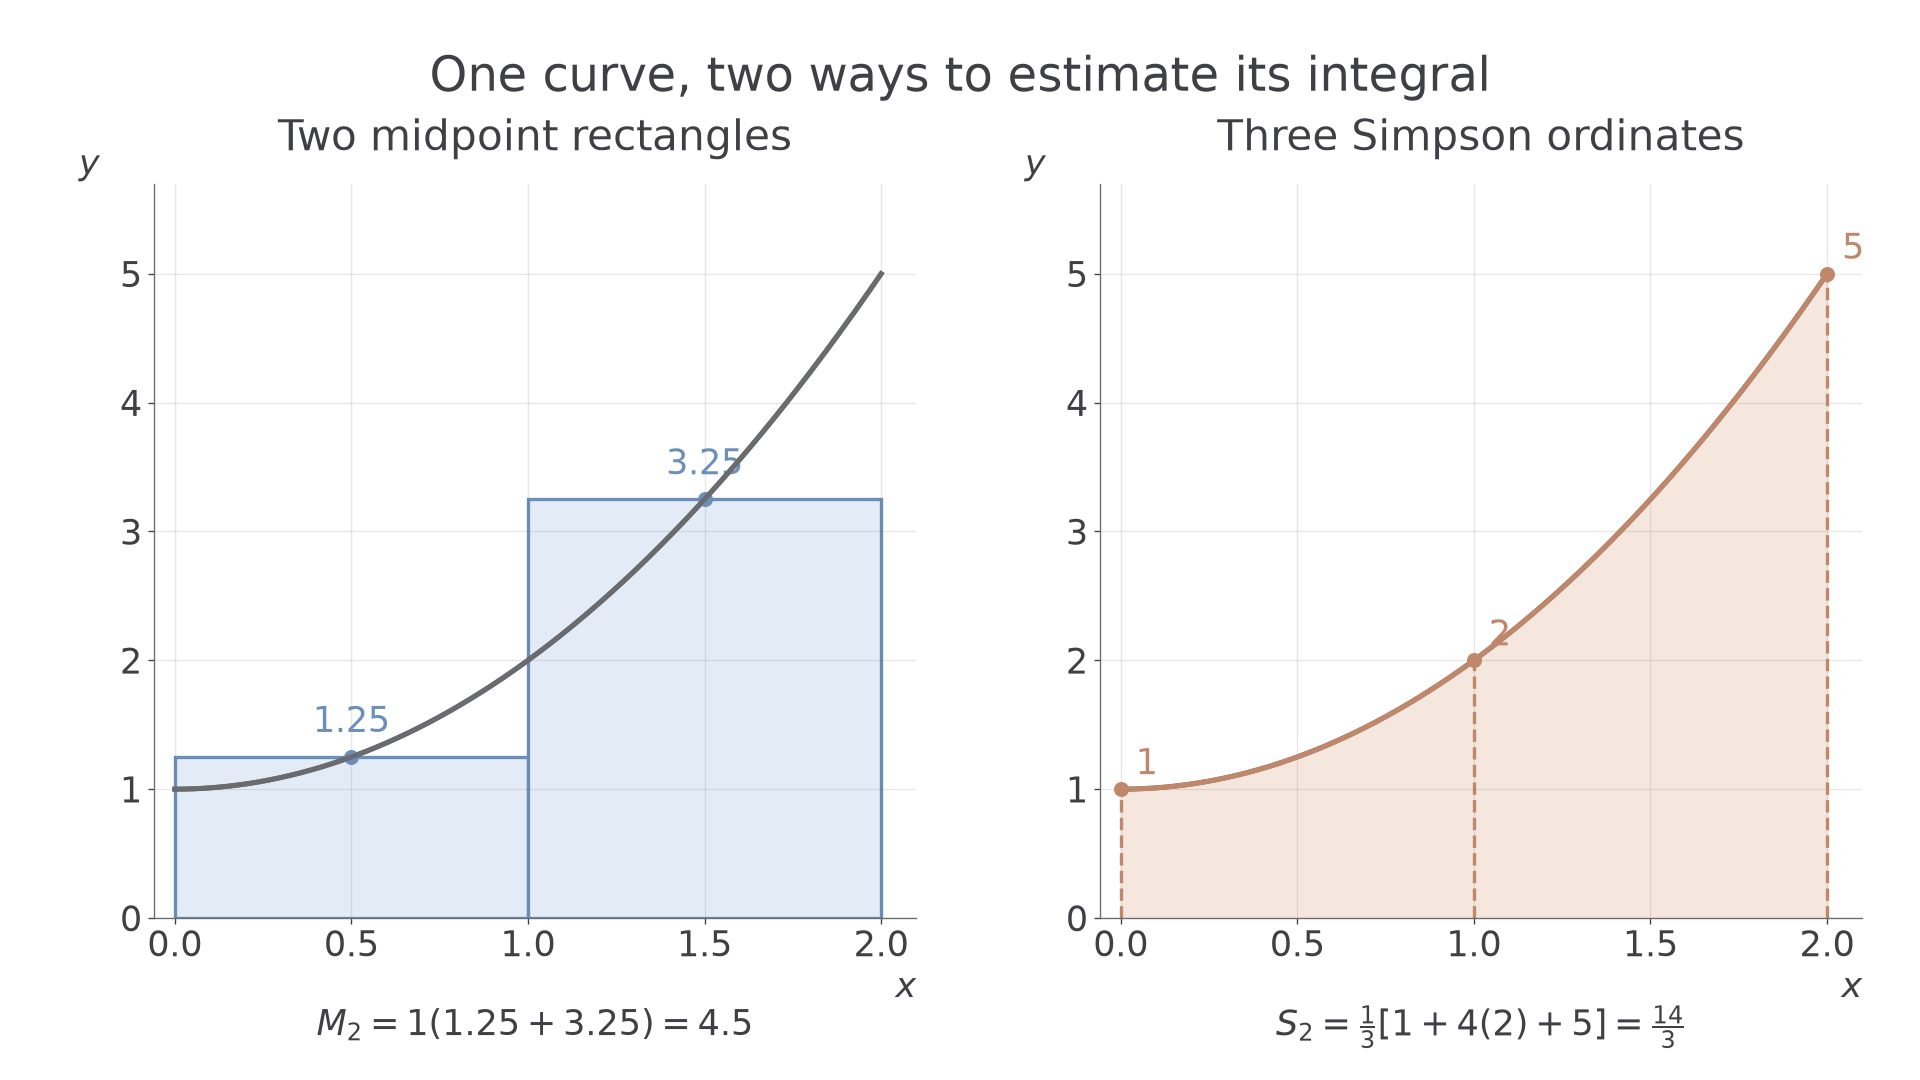
Use both rules on the same integral so that only the shape approximation changes.
Worked example 1: midpoint rectangles
Question. Use two mid-ordinate rectangles to estimate .
Plan. Find the width and the two midpoint heights, then add their rectangle contributions.
Answer. The estimated integral is .
Check. Direct integration gives . The rectangle answer is close but is not exact.
Keep the interval and integrand, and change only the rule. Three endpoint heights now describe a quadratic exactly.
Worked example 2: a quadratic fit
Question. Use Simpson’s rule with three ordinates to estimate the same integral, .
Plan. Three ordinates make two subintervals; apply weights .
Answer. . Here the estimate equals the exact integral because the integrand is the fitted quadratic.
Check. The antiderivative again gives , independently of the numerical weights.
This is the opening surprise: a finite set of heights can determine an exact integral for a suitable function. It does not make Simpson’s rule exact for every curved boundary.
Watch out
For two mid-ordinate rectangles on , use . For Simpson’s rule with three ordinates, use . Midpoints and endpoint ordinates belong to different formulas.
Try the same comparison with a changed coefficient.
Use equal widths and the correct sample points
A list of heights alone does not determine an integral: their horizontal spacing matters too.
For mid-ordinate data, locate the subinterval boundaries first. Four equal subintervals on have width , boundaries , and midpoint positions . The midpoints are half a step inside the interval. For Simpson data on the same four subintervals, use all five boundary positions instead.
Equal spacing
A common-width quadrature formula requires every gap between consecutive boundary positions to equal . For midpoint samples, consecutive sample positions also differ by , and the two outer boundaries are half a step beyond the first and last midpoints.
For unequal subintervals, you may still add individual midpoint rectangles as , using each actual width and midpoint. The composite Simpson weights with one common cannot simply be applied to unevenly spaced data. If more values can be calculated from a function, choose a suitable equally spaced grid. A table of measurements does not authorise inventing extra values.
Worked example 3: midpoint data on a known interval
Question. Four equal subintervals cover . Their midpoint heights are , in order. Use the mid-ordinate rule to estimate the integral.
Plan. Obtain the width from the boundaries, then multiply the sum of heights by that width.
Answer. The estimated integral is .
Check. The mean sampled height is . Interval length times mean height is , the same total by a different calculation.
Now stretch the horizontal interval by a factor of two, leaving the four heights unchanged. The integral estimate must stretch by the same factor.
Worked example 4: the same heights over twice the width
Question. Four equal subintervals now cover , with midpoint heights . Estimate the integral by the mid-ordinate rule and state the midpoint positions.
Plan. Recalculate the width; locate each sample half a step from its left boundary.
Answer. The estimate is , using midpoints .
Check. The mean height is still , but the interval length is now , giving . Doubling the horizontal scale doubled the estimate.
The same scale factor multiplies Simpson’s estimate because its formula also has a single factor of .
Watch out
Wrong: four subintervals mean . Correct: divide by four. Five is the number of boundary ordinates, not the number of widths.
Use a fresh interval and fresh midpoint data.
Continue this lesson.
You’re previewing NovaLearn without an account. Create a free account to read the rest.
Create free account