SA1, SA2 - Discrete probability distributions
A probability table describes what a random quantity can do before you observe it. SA1 introduces tables and probability functions; SA2 uses them to find probabilities, including events with a condition. You will learn to check a proposed model before trusting its predictions.
Tables and probability functions
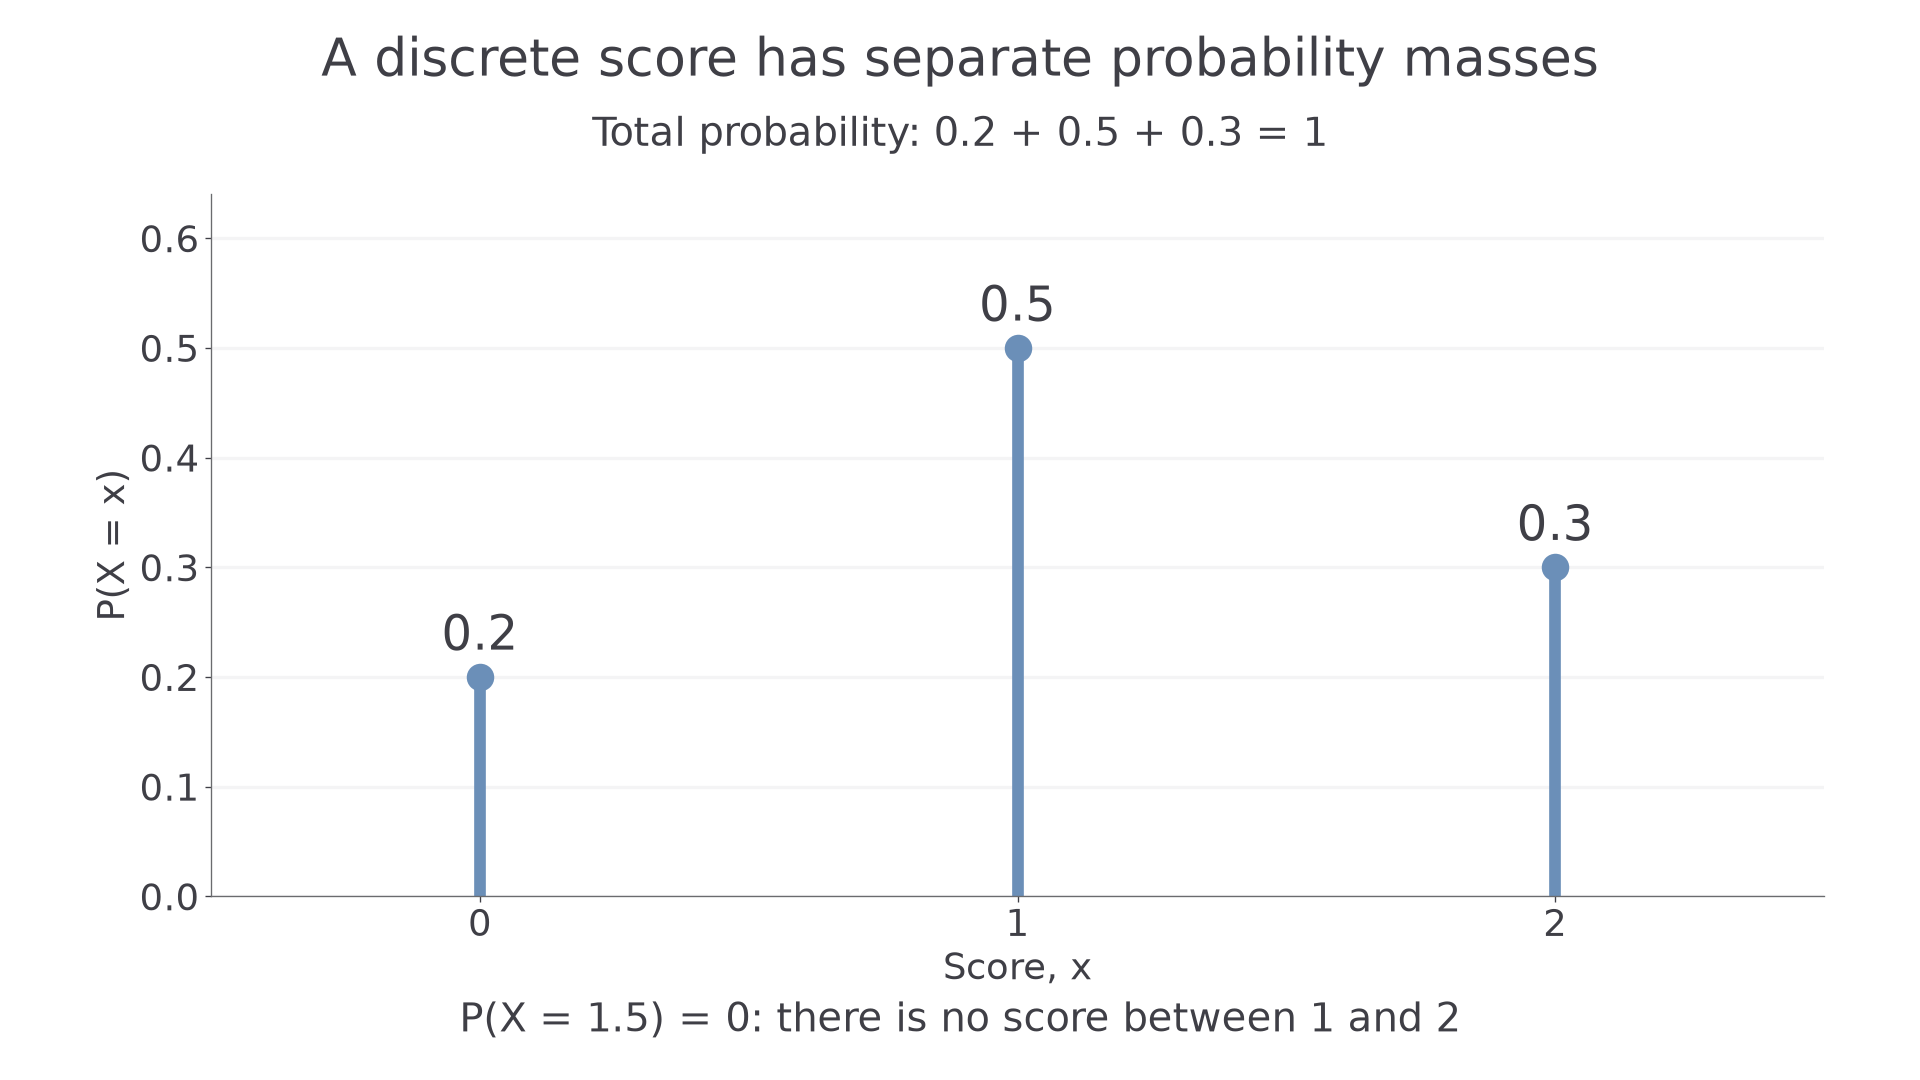
A game awards 0, 1 or 2 points with probabilities 0.2, 0.5 and 0.3. Given that you score at least 1 point, what is the probability you score 2? We first need to distinguish the score from its probability.
A random variable assigns a number to each outcome of a chance experiment. Let be the score before playing; denotes a particular possible score. A discrete random variable has a finite or countably infinite set of possible values, rather than every value in an interval. Discrete values need not be integers: a payment could take only the values , and pounds.
Probability distribution
A discrete probability distribution specifies the possible values and the probability of each. The set of values having positive probability is its support. A probability table may also include zero-probability entries; unlisted values have probability zero when the table is stated to be complete.
For the game, the complete distribution is:
| 0 | 1 | 2 | |
|---|---|---|---|
| 0.2 | 0.5 | 0.3 |
[DIAGRAM: asset_name: Separate probabilities for a discrete score; asset_slug: aqa7367-discrete-score; caption: Probability is attached to each separate score; no intermediate score is possible; description: Three vertical probability spikes at scores 0, 1 and 2 have labelled heights 0.2, 0.5 and 0.3. The horizontal axis is score x and the vertical axis is P(X=x). A note says total probability 0.2 plus 0.5 plus 0.3 equals 1 and P(X=1.5)=0.]
These probabilities describe a model, not the exact frequencies in a short run. If observed values occur with frequencies , those are counts. The relative frequencies can estimate probabilities , but they are not automatically the model's exact probabilities.
You already know notation such as : the symbol means “has the distribution”. Here is binomial, is the fixed number of trials, is the common success probability and is the failure probability, with independent binary trials. The game table itself does not assert a binomial model. Later, will denote its expectation and its variance.
Worked example 1: reading a table
Question. For the game table above, find and .
Plan. Read the probability of a listed value; use zero for a value outside the support.
The table lists every possible score, so the gap between 1 and 2 contains no further scores.
Answer. and , respectively.
Check. The three listed events already have total probability ; no extra positive probability is available for 1.5.
Change only the representation: a function can contain exactly the same information as a table.
Worked example 2: reading a function
Question. The game has
Find and .
Plan. Select the relevant branch of the function for each value.
Answer. Again and . Changing notation has not changed the distribution.
Check. Converting the nonzero branches back to a table recovers all three entries of the original table.
Read the support before substituting into any algebraic rule.
Watch out
is the random score, is a possible value, and is its probability. A frequency of 5 is possible; a probability of 5 is not.
Try an algebraic function with a different support.
Valid probability masses
The possible values are mutually exclusive: one observation of cannot equal two different values at once. Their probabilities therefore add. If the list is exhaustive, one of them must occur, giving total probability 1.
Checking a discrete distribution
For a complete discrete distribution,
Together these imply . These general validity conditions are required knowledge; they are not separately printed in the formula booklet.
The values themselves may be negative; only their probabilities must be nonnegative. A zero probability is allowed in a table, although that value then lies outside the positive-probability support.
Worked example 3: checking both conditions
Question. A complete table for gives probabilities . Is it valid?
Plan. Check every mass, then check the total.
Answer. Yes. Negative is a permitted value, and both probability conditions hold.
Check. The complementary events and have probabilities and , which sum to 1.
Continue this lesson.
You’re previewing NovaLearn without an account. Create a free account to read the rest.
Create free account