4.6.1.2a - Wave Properties and Equations
Waves transfer energy from one place to another. To describe a wave clearly, you need a small set of quantities: amplitude, wavelength, frequency, period and wave speed. This lesson is about what those quantities mean, how to read them from wave diagrams, and how to use the two AQA wave equations.
Describing a wave
A wave is a repeating disturbance. In GCSE wave diagrams, the undisturbed position is the middle or equilibrium position: the position a point would have if there were no wave passing.
The key wave quantities are:
- Amplitude: the maximum displacement of a point on the wave from its undisturbed position.
- Wavelength: the distance from one point on a wave to the equivalent point on the adjacent wave, such as crest to crest or trough to trough.
- Frequency: the number of waves passing a point each second.
- Period: the time for one complete wave, or one complete oscillation, to pass.
- Wave speed: the speed at which energy is transferred, or the wave moves, through the medium.
Frequency is measured in hertz, Hz. A frequency of 1 Hz means one wave passes a point every second. Period is measured in seconds, s. Wave speed is measured in metres per second, m/s.
Wave Speed
Wave speed is the speed at which energy is transferred, or the wave moves, through the medium.
Do not confuse the speed of the wave with the speed of an individual vibrating point. For example, a point on a rope can move up and down while the wave pattern travels along the rope.
Reading wave diagrams
A displacement-distance graph shows the shape of a wave at one instant. The horizontal axis is distance along the wave, not time. The vertical axis is displacement from the undisturbed position.
[DIAGRAM: asset_name: Amplitude and wavelength on a wave graph - diagram 1; asset_slug: 084_4_6_1_2a_wave_properties_and_equations_diagram1; file: diagram_assets/084_4_6_1_2a_wave_properties_and_equations_diagram1.png; recommended_method: deterministic_drawn; description: Exact displacement-distance sine-wave diagram with distance along wave in metres and displacement in metres. The equilibrium line is labelled, amplitude is shown by a vertical double-headed arrow from equilibrium to a crest labelled 0.20 m, and wavelength is shown by a horizontal double-headed arrow between adjacent crests labelled 2.0 m. This is an assessed/exact visual for identifying amplitude and wavelength; deterministic drawing is used for precise axes, labels and arrow placement. Nearby prose explains the labels for accessibility.]
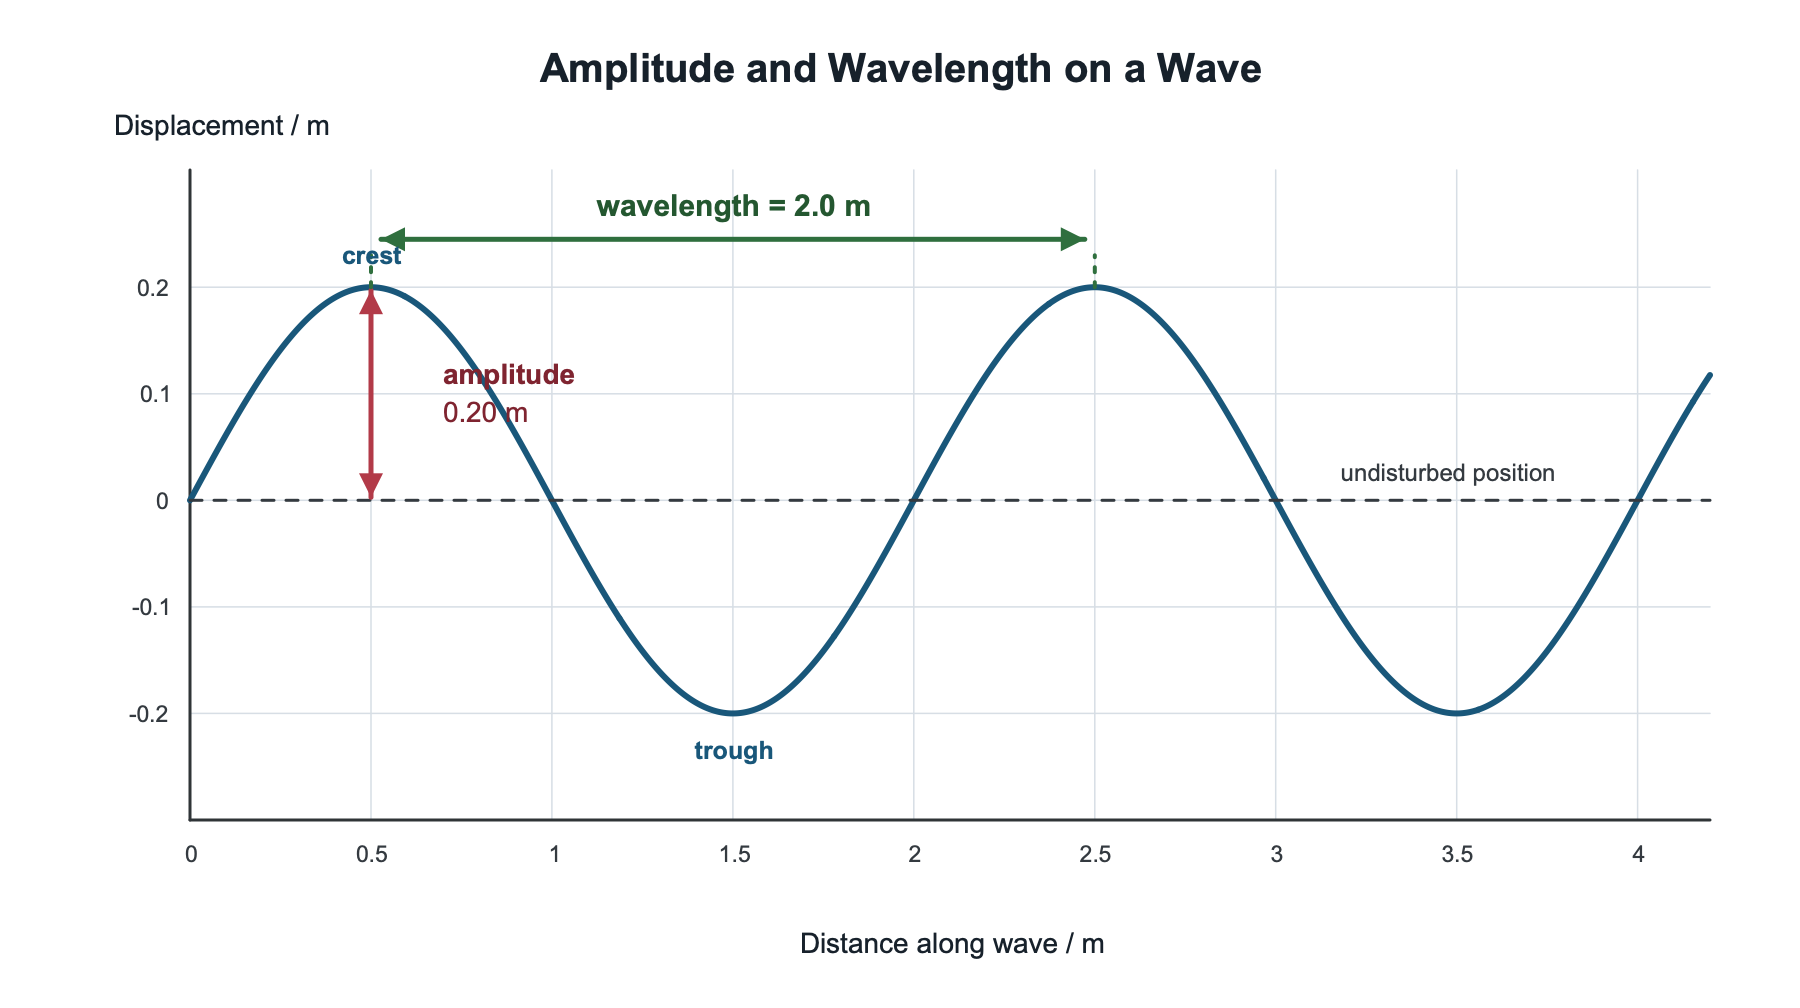
Amplitude is read vertically from the undisturbed position to a crest or to a trough. The distance from crest to trough is not the amplitude; it is twice the amplitude.
Wavelength is read horizontally between two equivalent points on adjacent waves. Crest to next crest works, trough to next trough works, and any point to the next matching point in the same part of the cycle works. Crest to the next trough is only half a wavelength.
Frequency and period
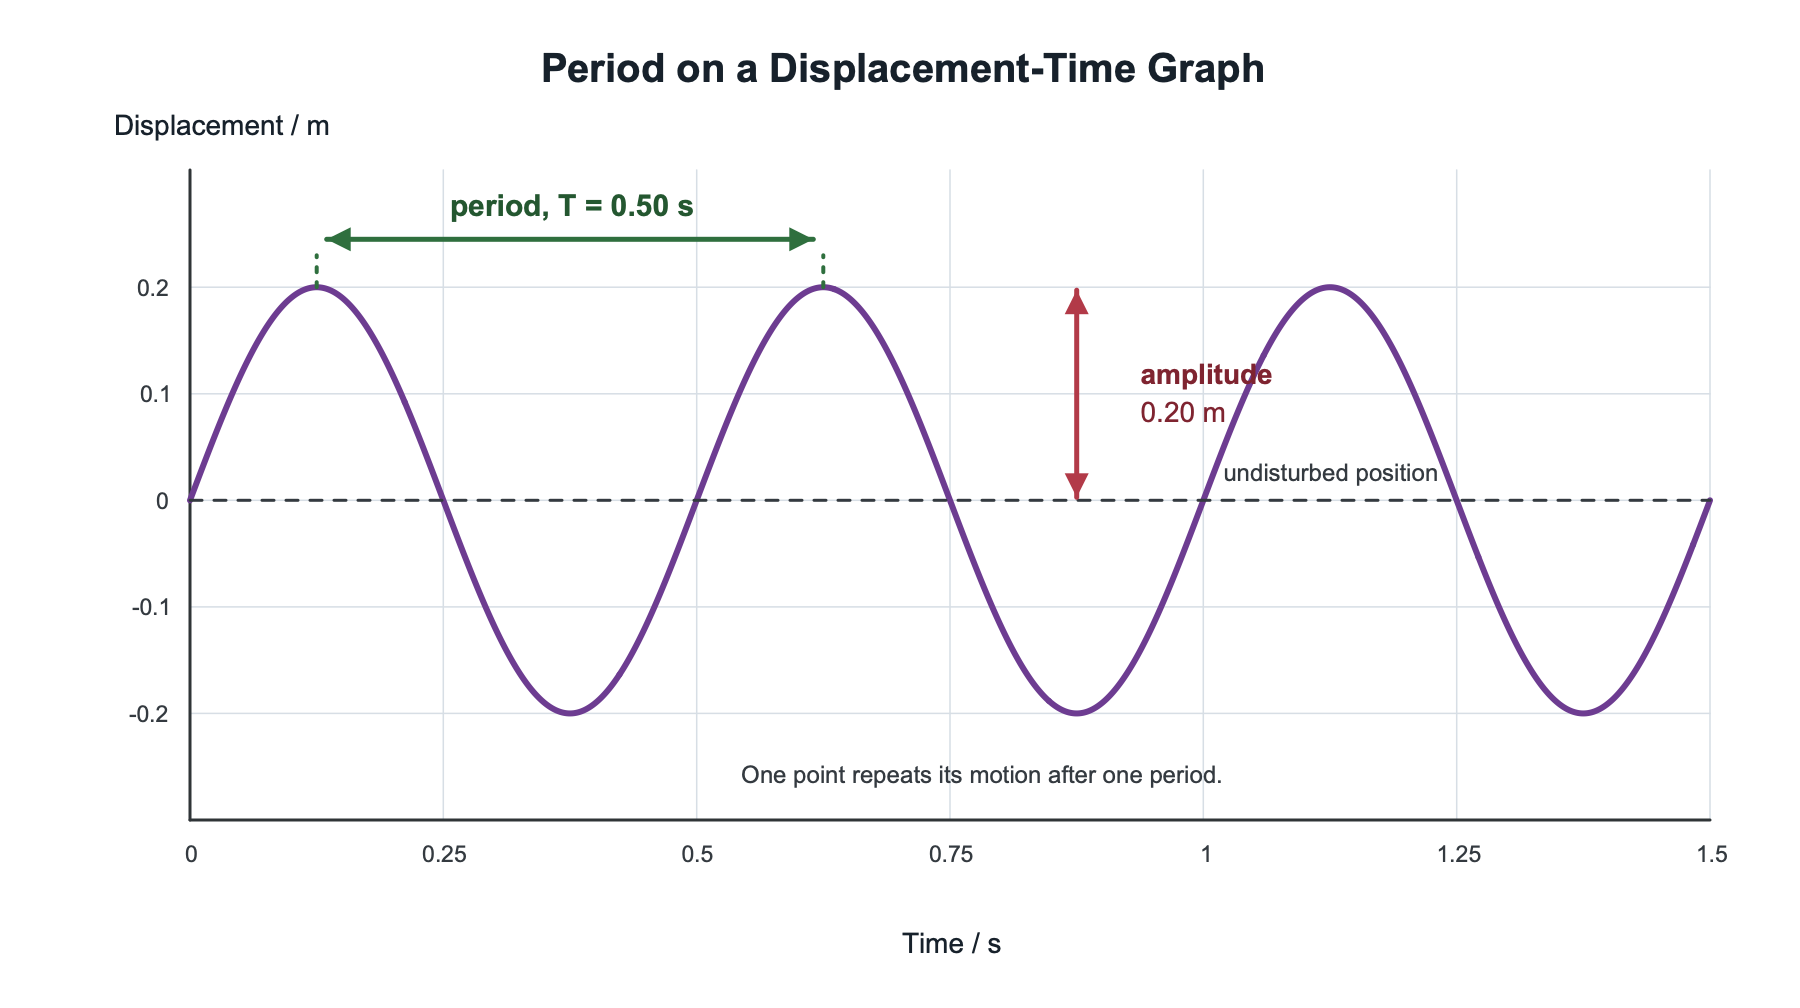
Frequency and period describe the same repeating motion in different ways. Frequency asks, "How many complete waves happen each second?" Period asks, "How long does one complete wave take?"
[DIAGRAM: asset_name: Period on a displacement-time graph - diagram 2; asset_slug: 084_4_6_1_2a_wave_properties_and_equations_diagram2; file: diagram_assets/084_4_6_1_2a_wave_properties_and_equations_diagram2.png; recommended_method: deterministic_drawn; description: Exact displacement-time sine-wave diagram for one point on a wave. Adjacent crests are separated by a labelled period of 0.50 s and the amplitude is held at 0.20 m. This exact visual supports the period-frequency equation and uses deterministic drawing for precise time-axis and arrow placement.]
Continue this lesson.
You’re previewing NovaLearn without an account. Create a free account to read the rest.
Create free account