4.3.2.3b - Heating and Cooling Graphs
Heating and cooling graphs show how the temperature of a substance changes as energy is transferred to it or away from it. The most important skill is spotting the difference between a sloping section, where temperature changes, and a flat section, where a change of state happens at constant temperature. This also helps you separate specific heat capacity from specific latent heat.
Reading graph sections
A heating or cooling graph usually has temperature on the vertical axis. The horizontal axis may be energy transferred, or it may be time if the substance is being heated or cooled at a steady rate.
[DIAGRAM: asset_name: Heating and Cooling Graphs - diagram 1; asset_slug: 035_4_3_2_3b_heating_and_cooling_graphs_diagram1; file: diagram_assets/035_4_3_2_3b_heating_and_cooling_graphs_diagram1.png; recommended_method: deterministic_drawn; description: Exact two-panel graph visual. Left panel is a heating graph with labelled sections A-B solid warming, B-C melting plateau, C-D liquid warming, D-E boiling plateau, and E-F gas warming. Right panel is a cooling graph with labelled sections A-B gas cooling, B-C condensing plateau, C-D liquid cooling, D-E freezing plateau, and E-F solid cooling. Temperature is on the y-axis; the x-axes are energy transferred to the substance or energy transferred away from the substance. It teaches that sloping sections mean temperature change and flat sections mean state change at constant temperature. Deterministic drawing is used because the axes, labels and graph shapes are exact assessed information.]
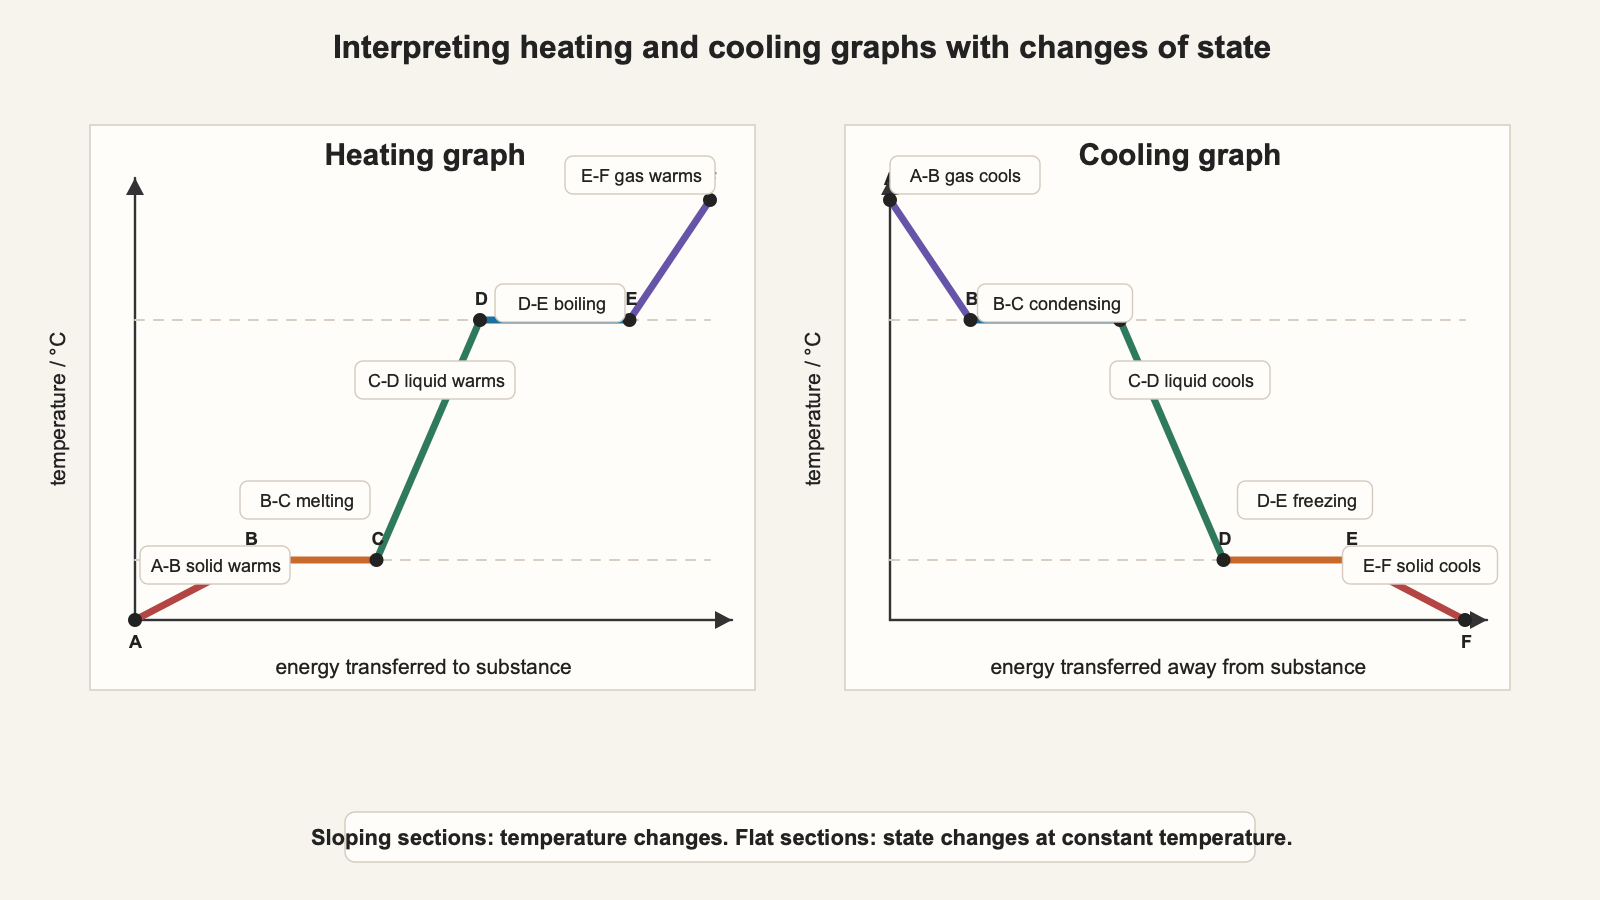
Read each section by asking two questions:
- Is the line sloping? If yes, the temperature is changing.
- Is the line flat? If yes, the substance is changing state at constant temperature.
On a sloping section, the substance stays in one state. Energy transferred changes the average kinetic energy of the particles, so the temperature rises on a heating graph or falls on a cooling graph.
On a flat section, temperature does not change. Energy is still being transferred, but it changes the internal energy linked to the arrangement of the particles as the substance changes state.
Heating graphs
On a heating graph, energy is transferred to the substance. The graph generally moves through these stages:
- solid warms up
- solid melts at the melting point
- liquid warms up
- liquid boils at the boiling point
- gas warms up
During melting and boiling, the graph is flat. That does not mean no energy is being transferred. It means the energy is being used to change state rather than to increase temperature.
The temperature of a flat section gives the temperature of the change of state. The melting plateau is at the melting point. The boiling plateau is at the boiling point.
If the horizontal axis is energy transferred, the length of a flat section shows how much energy is needed for that change of state. If the horizontal axis is time, this comparison is only valid when the heating power is constant.
Cooling graphs
On a cooling graph, energy is transferred away from the substance. The temperature decreases on sloping sections, and the state changes on flat sections.
The cooling sequence is the reverse of heating:
- gas cools down
- gas condenses at the boiling point
- liquid cools down
- liquid freezes at the melting point
- solid cools down
For the same substance at the same pressure, condensing happens at the same temperature as boiling, and freezing happens at the same temperature as melting. The graph is flat during condensing and freezing because the energy transferred away changes the state while the temperature stays constant.
A common mistake is to write "the temperature is not changing, so nothing is happening". Something is happening: particles are becoming more closely arranged as the substance changes from gas to liquid or from liquid to solid.
Continue this lesson.
You’re previewing NovaLearn without an account. Create a free account to read the rest.
Create free account