4.4.2.3b - Net Decline After Half-Lives
This is a Higher tier calculation skill. Once you know how many half-lives have passed, you can work out how much radioactive emission remains compared with the starting value. The safest exam habit is to keep the order of the ratio clear.
What the ratio compares
A radioactive sample does not lose the same number of undecayed nuclei in each equal time interval. Instead, after each half-life, the number of undecayed nuclei halves. The activity or count rate from the sample also halves, because these are proportional to the number of undecayed nuclei.
In this lesson, the net decline ratio means:
emission after the half-lives : initial emission
So if a source starts at 800 counts/s and later has a count rate of 100 counts/s, the ratio is:
100 : 800 = 1 : 8
That means the emission is now 1/8 of the original value. If a question asks for the ratio in the opposite order, initial : final, reverse the ratio and write 8 : 1 instead.
Net decline ratio
For this Higher tier skill, the net decline ratio compares the radioactive emission after a number of half-lives with the initial emission. It is usually written as final : initial, such as 1 : 8.
Use the same ratio idea for count rate, activity, or number of undecayed nuclei. Do not mix different quantities in one ratio.
The halving pattern
Each half-life halves the current emission, not the original emission. That repeated halving gives a pattern.
0 half-lives: 1 of the original emission remains
1 half-life:  1/2 remains
2 half-lives: 1/4 remains
3 half-lives: 1/8 remains
4 half-lives: 1/16 remains
[DIAGRAM: asset_name: half-life-net-decline-ratio-chart - diagram 1; asset_slug: 046_4_4_2_3b_net_decline_after_half_lives_diagram1; file: diagram_assets/046_4_4_2_3b_net_decline_after_half_lives_diagram1.png; recommended_method: deterministic_drawn; description: Exact assessed chart showing remaining emission after 0 to 5 half-lives as fractions of the initial value: 1, 1/2, 1/4, 1/8, 1/16 and 1/32. It should label the ratio order as final : initial and show examples such as 3 half-lives gives 1 : 8. Deterministic drawing is used because Matplotlib is unavailable in this environment and the bars, axis, fractions and labels must be exact and readable.]
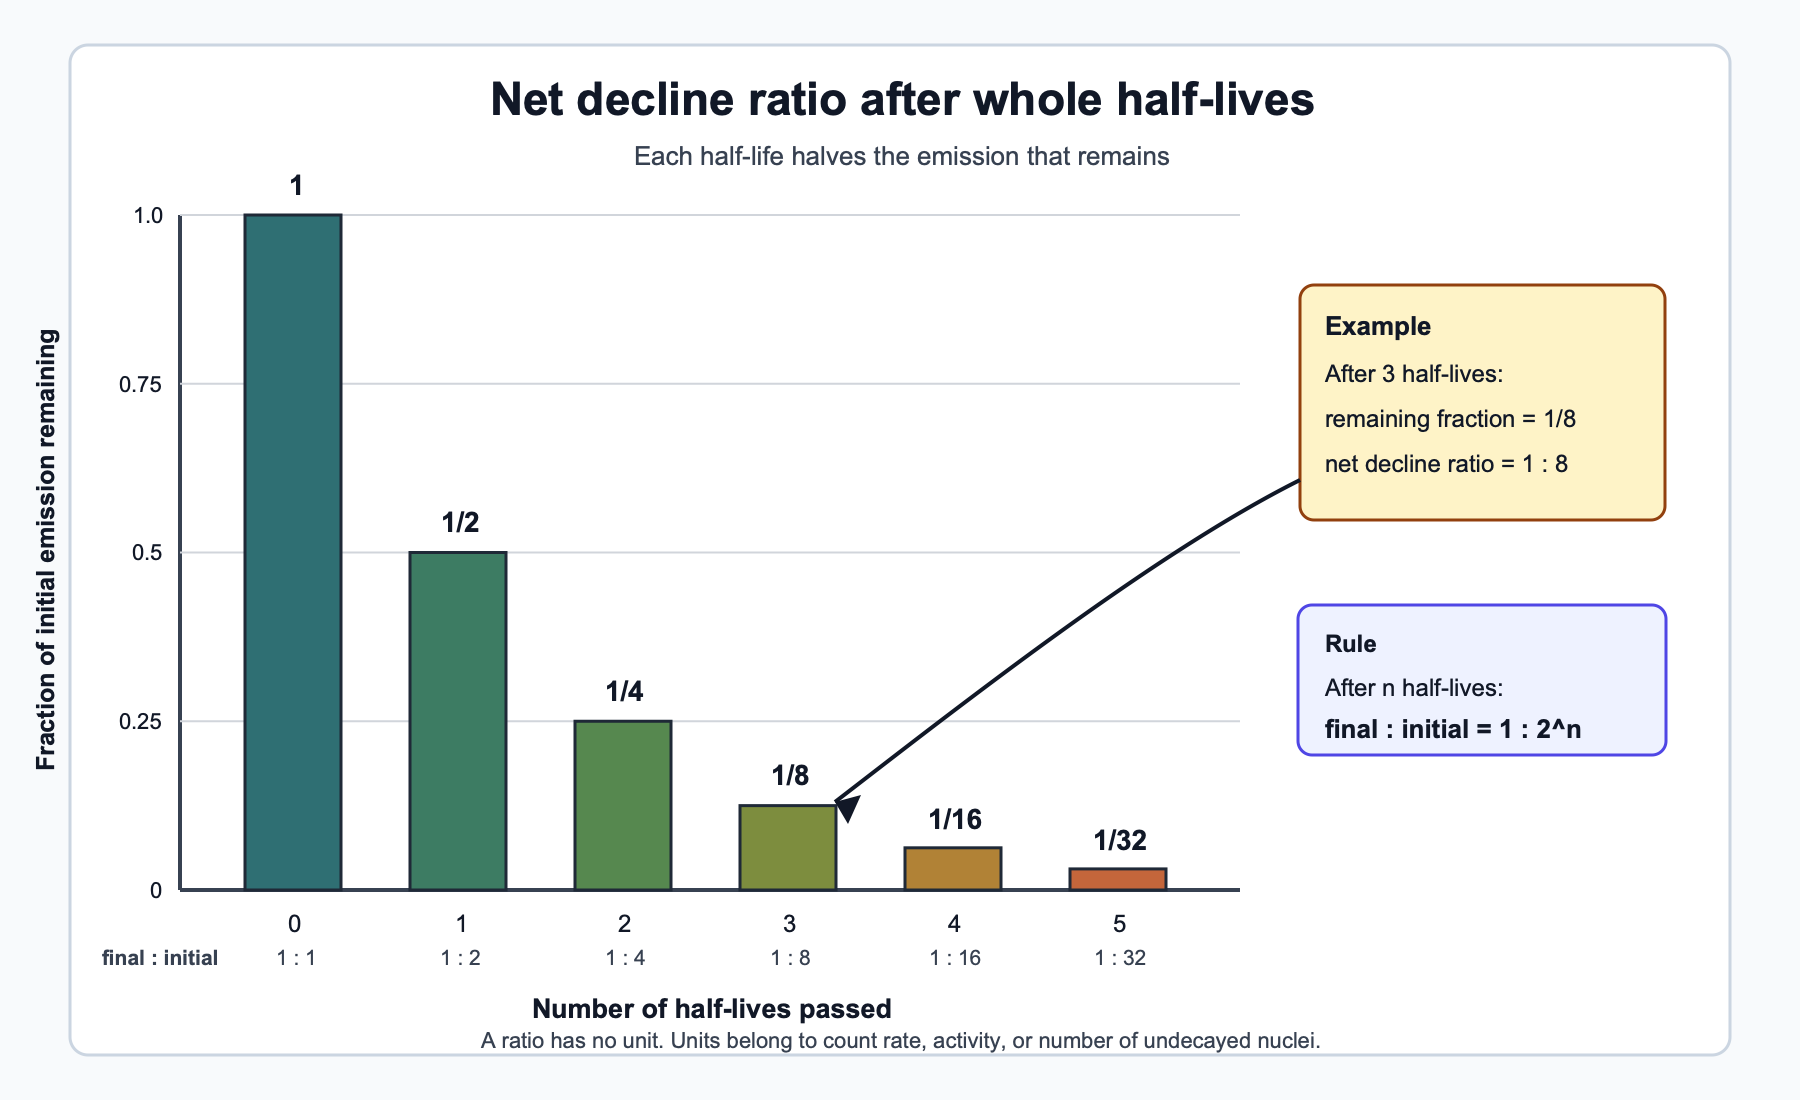
The denominator doubles each time:
after n half-lives, remaining fraction = 1 / 2^n
So the net decline ratio in the order final : initial is:
1 : 2^n
For example, after 5 half-lives:
2^5 = 32
net decline ratio = 1 : 32
The common mistake is to count the first half-life correctly, then forget that the second half-life halves 1/2 to make 1/4, not another 1/2 taken from the original amount.
Continue this lesson.
You’re previewing NovaLearn without an account. Create a free account to read the rest.
Create free account