Paper 3 - Reading scientific articles and synoptic evidence
A scientific article can bring familiar biology into an unfamiliar setting. This Paper 3 skills lesson uses a complete original practice article to connect molecular mechanisms, experimental design and numerical evidence. You will learn how to decide what a study supports and how to develop a connected biological answer.
Reading an unfamiliar biological article
Read an unfamiliar term by asking what it does in the biological system, then connect it to an idea you already know.
Paper 3, 9BN0/03, can draw on Topics 1–8 and link two or more topics in one question. A scientific article underpins one section and is released eight weeks before the examination. The Summer 2027 article is not available in this course at the time of writing; this lesson makes no prediction about it. Use the series-specific article when Pearson lawfully releases it through your centre.
Article A: Switching a yeast protein factory on
Complete original NovaLearn practice scientific article, written 15 October 2026. The study, yeast lines and every numerical result below are fictional teaching material. The molecular principles are biologically grounded; these are not results from a real trial or Pearson's 2027 article.
P1. A genetically modified yeast can contain a gene coding for an insulin precursor. A precursor is a protein that needs further processing to produce the intended final molecule. Producing precursor in culture is only one stage towards producing insulin: recovery, correct processing, purification and tests of identity, activity and safety are still necessary. This study asked whether a controllable genetic switch could increase the concentration of precursor released into a culture liquid.
P2. The hypothetical engineered yeast contained an artificial transcription factor with a hormone-binding region and a DNA-binding region. The small molecule β-estradiol acted as an inducer: binding to the factor allowed it to activate transcription at a matching regulatory DNA sequence beside the precursor gene. A promoter is a DNA region at which transcription begins. This artificial switch uses a hormone-receptor component; it is not a claim that ordinary yeast naturally regulate insulin production. The researchers predicted that induction would increase gene expression, the use of a gene to produce its RNA and protein products.
P3. PCR on extracted DNA detected an internal fragment of the inserted precursor gene, with a negative no-template control and a positive control containing the target DNA. Sequencing checked the gene's base sequence. These checks did not measure gene expression. A separate sequence-specific RNA assay measured precursor-gene mRNA abundance four hours after treatment, normalised to the same reference RNA. The resulting relative units allow comparisons within this study. A calibrated protein assay measured released precursor concentration at 24 hours. It distinguished precursor from other proteins; the researchers did not measure the activity of finished insulin.
P4. For Table 1, six independently started cultures of one engineered line and six of its unmodified parental yeast were grown. Within each genotype, three cultures were randomly assigned inducer and three solvent alone. Final solvent concentration was identical in every flask. Starting viable-cell density, medium volume, glucose concentration, temperature, pH and shaking conditions were held the same. All were harvested at 24 hours. The assay reported concentration to the nearest . Each table entry is a separate culture, not three readings from one flask.
Table 1. Original practice data: precursor concentration at 24 hours, .
| Yeast and treatment | Culture 1 | Culture 2 | Culture 3 | Mean | Observed range |
|---|---|---|---|---|---|
| Unmodified, solvent only | 0.0 | 0.0 | 0.0 | 0.0 | 0.0–0.0 |
| Unmodified, inducer | 0.0 | 0.0 | 0.0 | 0.0 | 0.0–0.0 |
| Engineered, solvent only | 3.0 | 4.0 | 5.0 | 4.0 | 3.0–5.0 |
| Engineered, inducer | 10.0 | 12.0 | 14.0 | 12.0 | 10.0–14.0 |
P5. The engineered line released some precursor without induction and more with induction. Neither unmodified group gave a precursor signal above the assay blank; these results were recorded as 0.0. A validated detection limit was not reported. The authors concluded that induction increased released precursor concentration under these conditions. Only one engineered line, one inducer dose and one 24-hour endpoint were tested in this comparison. No statistical test or confidence interval was reported. A reported zero does not prove that absolutely no precursor molecules were present.
P6. In a second investigation, eight independently generated engineered lines, A–H, received the same inducer treatment. One culture was measured per line. Each RNA sample at four hours and liquid sample at 24 hours came from the same culture. Starting conditions matched Table 1, but final viable-cell density was not measured. Table 2 shows every paired result; it is not a time series. The authors suggested that transcript abundance might help identify productive lines, while recognising that the lines could differ in other properties.
Table 2. Original practice data: eight induced engineered lines.
| Line | Relative precursor-gene mRNA abundance at 4 hours / units | Precursor concentration at 24 hours / |
|---|---|---|
| A | 2 | 8 |
| B | 3 | 12 |
| C | 4 | 13 |
| D | 5 | 18 |
| E | 6 | 20 |
| F | 7 | 12 |
| G | 8 | 28 |
| H | 9 | 30 |
P7. All cultures were kept in closed laboratory vessels. The group proposed testing more independently generated lines and measuring final viable-cell density, because concentration per litre can depend on both production per cell and the number of living cells. It also proposed repeated cultures of each line on different days. Escaped modified yeast and biologically active inducer in waste would require containment and validated waste treatment; the study did not test environmental release.
P8. The authors described a promising laboratory production step, not a finished medicine. Their next questions were whether the change persisted at larger scale, whether the precursor could be processed into active insulin and whether the final purified material met quality and safety requirements. No patients, treatment outcomes or medicine prices were studied.
Meaning from context
“Inducer” in P2 means a signal that increases expression in this particular genetic system. It does not mean a nutrient or the protein product. “Precursor concentration” in P1 and Table 1 is mass per volume in the culture liquid; it is not a measure of therapeutic activity. “Normalised” in P3 means expressed relative to a reference measurement, so the mRNA values are comparable units rather than literal counts of all RNA molecules.
Gene expression
The use of a gene's information to produce an RNA product and, for a protein-coding gene, a polypeptide through transcription and translation.
When vocabulary is unfamiliar, keep the article's distinctions. DNA presence, RNA abundance, released protein concentration and medicine activity are four different measurements. Replacing all four with “more insulin” would erase the very differences needed to interpret the evidence.
Separating claims from observations
An article combines observations with interpretations, and a sound reading keeps their roles distinct.
A method states what was done or measured: for example, assigning cultures to treatment or measuring concentration after 24 hours. An observation is a reported measurement or result, such as the induced engineered mean of . An inference is a conclusion drawn from evidence, such as induction increasing output in the tested line. A claim is an assertion that can be checked against evidence; it may be well supported, tentative or overstated. These categories overlap: an inference can also be a claim. They are not four mutually exclusive labels for every sentence.
P4 describes the design. Table 1 provides observations. P5 draws a bounded inference from them. P6's suggestion about selecting productive lines goes beyond listing values and needs evidence from several lines. P8 identifies questions the study has not answered. A sentence written confidently in an article is still open to examination.
For example, “the switch produced a higher mean precursor concentration in this line” is supported by Table 1. “The switch will make insulin cheaper for every patient” adds assumptions about manufacturing scale, purification losses, regulation, distribution and price. None was measured. A plausible biological mechanism helps explain a result, but cannot fill every missing measurement.
When a task says deduce, reach a conclusion from the supplied information. When it says explain, add a biological reason connecting cause to outcome. Consider the difference: describing Table 1 gives the two means; explaining the difference links inducer binding to transcription and protein production. A description cannot earn an explanation's missing causal link merely by quoting more figures.
Comparing production quantities
A numerical comparison must identify its denominator before using a percentage.
Table 1 compares like quantities: both means are concentrations measured at the same endpoint. The induced-to-uninduced ratio is . The induced value is three times the original value, or 300% of it. The increase is only the additional , so it is a 200% increase, not a 300% increase.
For Table 1, . Concentration units cancel because numerator and denominator use the same unit.
A change from to has an absolute increase of ; this differs from a relative increase. The reverse comparison also has a different denominator: is of , to one decimal place. Relative to the higher value, the reduction is . State the direction and baseline instead of writing an unlabelled percentage.
Dividing by the unmodified value of zero cannot give a meaningful finite percentage increase. Report the actual concentrations and, if supplied, the validated detection limit instead; Article A does not provide that limit. Reporting resolution and detection limit are different properties. Also, a 200% concentration increase does not establish a 200% increase in active medicine recovered: processing recovery and activity were not measured. Keep calculation and biological interpretation connected.
Translating paired data into a scatter diagram
Each row of Table 2 supplies two measurements from one culture, so its pair must remain together when translated into a graph.
Use mRNA abundance on the horizontal axis and precursor concentration on the vertical axis, label both quantities and units, and choose even numerical scales covering all values. Line C becomes ; line G becomes . Conversely, reading point D gives relative units and , which reconstructs its table row. This is translation between numerical and graphical forms; changing representation must not change the data.
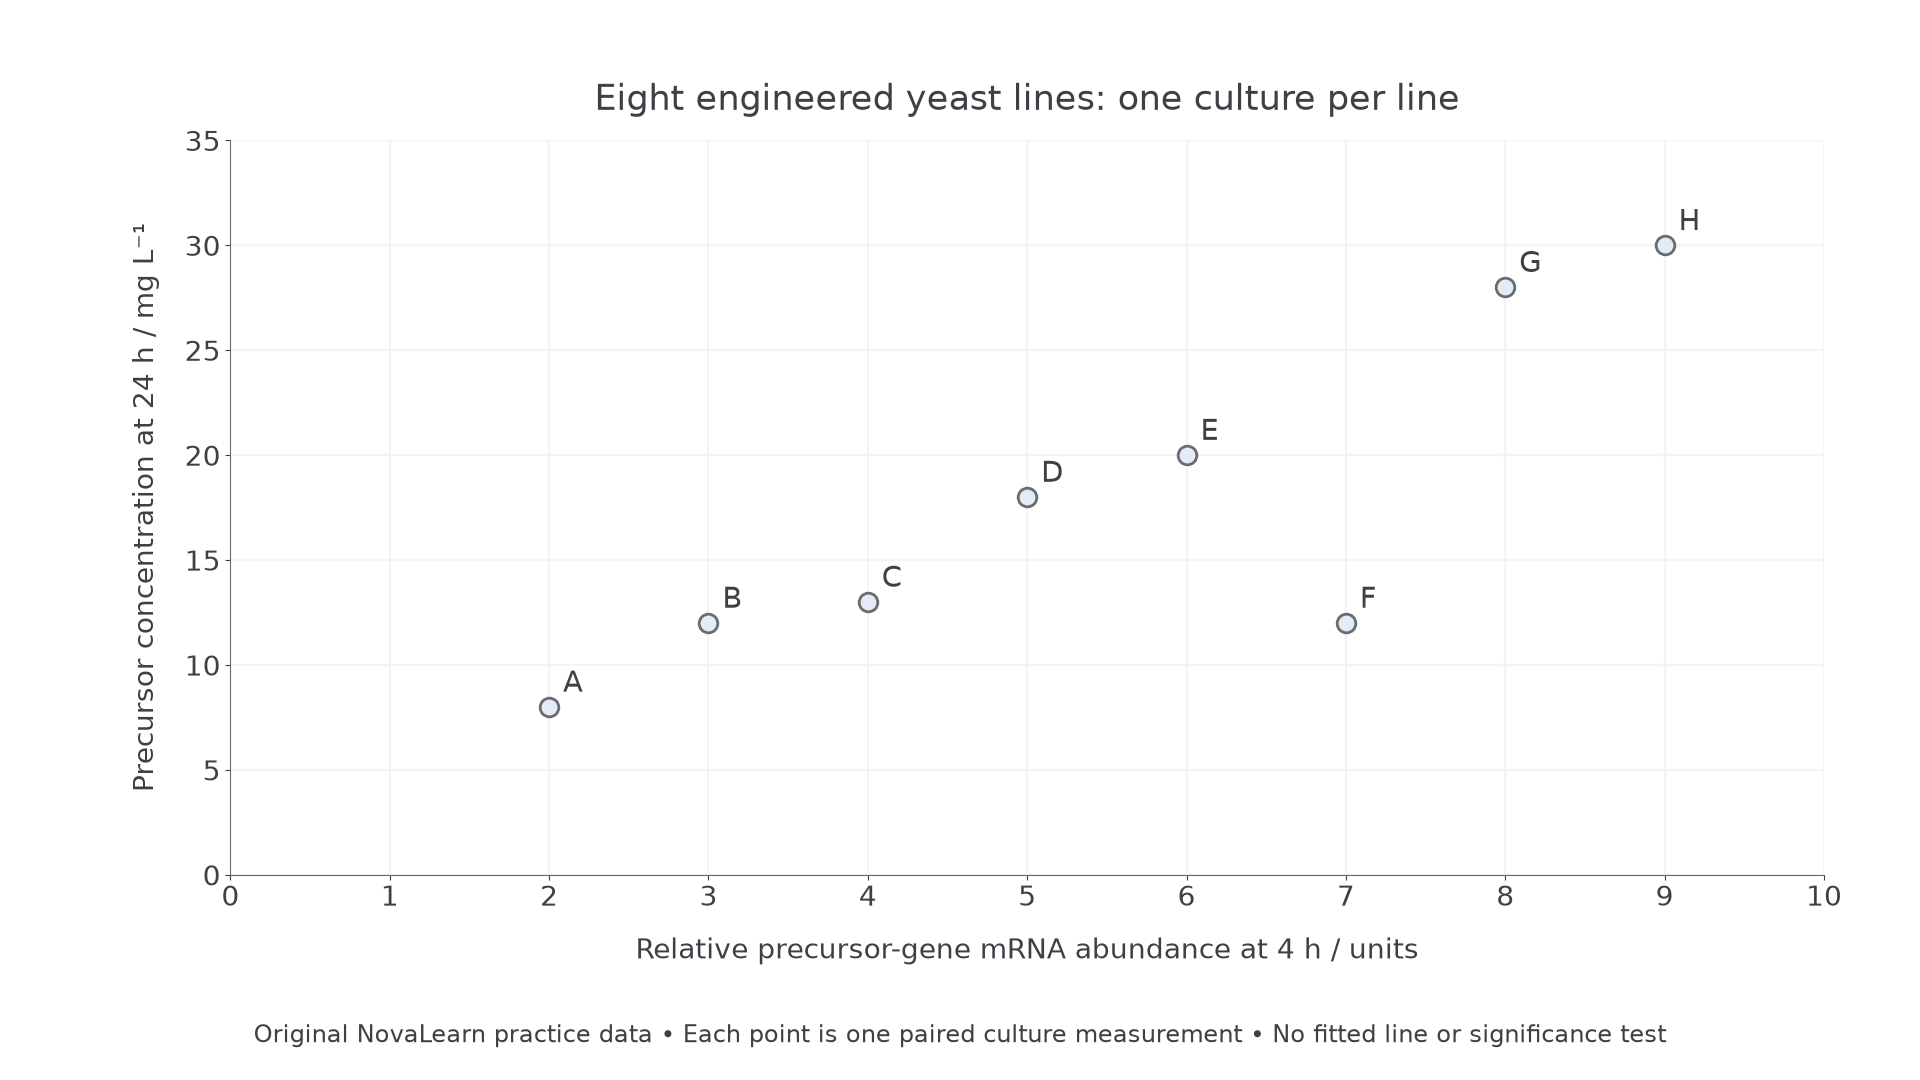
Figure 1. Original NovaLearn practice data from Table 2, with one paired culture measurement per line. There is no fitted line, confidence band or significance test.
Continue this lesson.
You’re previewing NovaLearn without an account. Create a free account to read the rest.
Create free account